
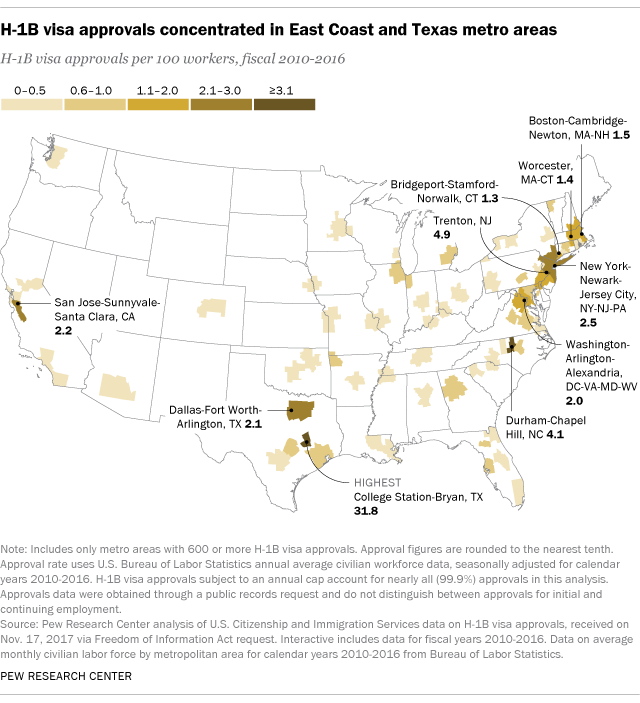
The employment of high-skilled foreign workers with H-1B visas centered in large East Coast metropolitan areas from fiscal years 2010 to 2016. These foreign workers also made up a significant part of the workforces in several Texas metro areas, according to a Pew Research Center analysis of previously unpublished metro-level government data of H-1B visa approvals obtained through a public records request.
The H-1B visa program is the nation’s largest temporary employment visa program. About 247,900 H-1B visa approvals – 29% of the nation’s total – went to employers in the New York City metro area from fiscal 2010 to 2016 (the most recent years for which data are available at the metropolitan level). The Dallas and Washington metro areas (74,000 and 64,800 approvals, respectively) had the next-highest totals, with Boston (38,300 approvals) also among the top metro areas by this measure. The data, obtained from U.S. Citizenship and Immigration Services, include details of those approved for an H-1B visa.
See below for an interactive table showing H-1B visa approvals, educational attainment and salaries in 68 metro areas that received 600 or more H-1B approvals from fiscal 2010 to 2016.
The H-1B visa program allows U.S. employers to hire foreigners to work for up to six years in jobs that require highly specialized knowledge, and workers’ employment may be extended if they have green card applications pending. To participate, employers must first submit applications to the U.S. Department of Labor. The application is then reviewed by U.S. Citizenship and Immigration Services (USCIS) before the State Department interviews the foreign worker and issues the visa.
Visas are awarded to employers on a first-come, first-served basis, with applications accepted each year beginning in April. If the number of applications exceeds an annual cap of 65,000 set by Congress during the first five business days of April, visas are then awarded through a lottery system. (An additional 20,000 H-1B visas are available for advanced degree graduates of U.S. colleges and universities.) Universities and colleges, nonprofits and government research institutions are exempted from the cap; they have accounted for about 10% of H-1B visa applications since fiscal 2010.
This analysis assumes “H-1B visa approvals” refers to foreigners who receive an H-1B visa and go on to work for the employer that sponsored them in the same fiscal year.
The data on H-1B visa approvals were obtained from USCIS through a Freedom of Information Act request and were received in November 2017. Approvals that are subject to the annual cap account for nearly all (99.9%) approvals in this analysis. The FOIA data does not distinguish between approvals for initial and continuing employment. It includes employer names and employer location (city and state) but excludes worker location, which could be at the employer location or another location. This analysis assumes H-1B visa approvals are for foreigners who will work at the employer location.
The number of H-1B visa approvals used for calculating the H-1B visa approvals per 100 workers is in fiscal years. To calculate this rate, this analysis uses data from Bureau of Labor Statistics on average monthly civilian labor force (seasonally adjusted) by metropolitan area for calendar years 2010-2016.
Correction (July 2018): A previous version of this “About this analysis” section inaccurately summarized the employer application process for H-1B visa participation.
When looking at the footprint of high-skilled foreign workers by metro area, College Station, Texas, stands far above the rest, with about 32 H-1B approvals per 100 workers. (More than 99% of the metro area’s H-1B approvals went to employees of Cognizant Technology Solutions Corp., whose U.S. headquarters is in College Station.) By comparison, no other metro area had more than five H-1B approvals per 100 workers.
The San Jose, California, metro area, home of Silicon Valley, trailed the leading metro area on these measures, despite being home to some of the world’s most famous technology companies. The San Jose metro area had 22,200 H-1B approvals from fiscal 2010 to 2016, which amounted to two approvals per 100 workers.
Every April, companies file thousands of H-1B visa applications to hire foreign workers. Many of these applications come from firms in the technology and finance sectors, as well as other fields that require specialized knowledge. The U.S. government approved more than 859,600 applications in fiscal 2010-2016.
Demand for the high-skilled worker visas has boomed in recent years, and the H-1B program is now the primary way employers in the U.S. hire high-skilled foreign workers. The program could shrink under the Trump administration, which has recently placed stricter requirements on applications.
Nationwide, foreign workers approved for H-1B visas earned an average of $80,600 in fiscal 2010-2016. Bridgeport, Connecticut, had the highest average salary ($100,200) of any metro area, followed by Seattle ($98,100) and Phoenix ($97,100). In College Station, the Texas metro area with the greatest concentration of H-1B workers in its workforce, the average salary in 2010-2016 was $82,600.
About half (49%) of H-1B approvals in recent years have gone to foreign workers with an advanced degree (master’s, professional or doctorate) earned either in the U.S. or internationally.
Learn more
Read key facts about the H-1B visa program and findings about H-1B worker salaries.
Some metro areas with relatively small numbers of H-1B approvals stood out in the hires of workers with advanced degrees. In Erie, Pennsylvania, three-fourths (75%) of H-1B approvals in fiscal 2010-2016 went to foreign workers with advanced degrees. That was followed by Memphis, Tennessee, and Phoenix (both 69%) and Sacramento, California (68%).
In some metro areas, a relatively high share of H-1B workers earned an advanced degree from a U.S. institution. (There have been local economic development efforts to retain foreign students after graduation.) In San Diego, 28% of H-1B approvals went to foreign workers with advanced degrees from a U.S. university or college, the highest level in the nation. Roughly one-in-four H-1B approvals in Oklahoma City (27%), Gainesville, Florida (27%), and Ann Arbor, Michigan (25%) went to those with U.S. advanced degrees.
H-1B visa approvals by metropolitan area, fiscal 2010-2016
| Metropolitan area | Total H-1B visa approvals | H-1B visa approvals per 100 workers | Average salary for H-1B visa approvals | % of H-1B visa approvals with an advanced degree | % of H-1B visa approvals with a U.S. advanced degree |
|---|---|---|---|---|---|
| New York-Newark-Jersey City, NY-NJ-PA | 247,900 | 2.501 | $80,000 | 47% | 13% |
| Dallas-Fort Worth-Arlington, TX | 74,000 | 2.126 | $77,100 | 43% | 12% |
| Washington-Arlington-Alexandria, DC-VA-MD-WV | 64,800 | 2 | $73,900 | 45% | 12% |
| Boston-Cambridge-Newton, MA-NH | 38,300 | 1.482 | $88,100 | 61% | 20% |
| College Station-Bryan, TX | 37,800 | 31.847 | $82,600 | 23% | 1% |
| Philadelphia-Camden-Wilmington, PA-NJ-DE-MD | 34,300 | 1.125 | $84,800 | 52% | 15% |
| Chicago-Naperville-Elgin, IL-IN-WI | 29,900 | 0.613 | $82,200 | 42% | 9% |
| Houston-The Woodlands-Sugar Land, TX | 28,900 | 0.917 | $81,900 | 59% | 20% |
| Atlanta-Sandy Springs-Roswell, GA | 28,500 | 1.014 | $74,600 | 53% | 14% |
| San Jose-Sunnyvale-Santa Clara, CA | 22,200 | 2.21 | $88,800 | 53% | 15% |
| Miami-Fort Lauderdale-West Palm Beach, FL | 14,700 | 0.502 | $70,600 | 38% | 13% |
| Detroit-Warren-Dearborn, MI | 13,900 | 0.682 | $72,300 | 47% | 9% |
| Durham-Chapel Hill, NC | 11,300 | 4.128 | $84,700 | 48% | 6% |
| San Francisco-Oakland-Hayward, CA | 11,300 | 0.466 | $90,500 | 51% | 15% |
| Tampa-St. Petersburg-Clearwater, FL | 10,800 | 0.756 | $82,600 | 55% | 17% |
| Trenton, NJ | 9,500 | 4.857 | $83,300 | 53% | 13% |
| Los Angeles-Long Beach-Anaheim, CA | 9,000 | 0.137 | $75,200 | 48% | 17% |
| Austin-Round Rock, TX | 8,300 | 0.82 | $85,600 | 62% | 22% |
| Baltimore-Columbia-Towson, MD | 7,400 | 0.505 | $77,100 | 62% | 19% |
| Pittsburgh, PA | 6,600 | 0.546 | $83,700 | 57% | 16% |
| Bridgeport-Stamford-Norwalk, CT | 6,300 | 1.35 | $100,200 | 60% | 20% |
| Richmond, VA | 5,800 | 0.898 | $86,500 | 60% | 14% |
| Seattle-Tacoma-Bellevue, WA | 5,200 | 0.267 | $98,100 | 51% | 17% |
| Hartford-West Hartford-East Hartford, CT | 4,900 | 0.785 | $81,500 | 58% | 17% |
| Worcester, MA-CT | 4,800 | 1.403 | $79,100 | 64% | 23% |
| Raleigh, NC | 4,400 | 0.703 | $79,600 | 63% | 19% |
| Charlotte-Concord-Gastonia, NC-SC | 4,400 | 0.367 | $82,800 | 55% | 16% |
| Orlando-Kissimmee-Sanford, FL | 3,600 | 0.305 | $76,200 | 51% | 15% |
| Providence-Warwick, RI-MA | 3,400 | 0.492 | $90,100 | 64% | 18% |
| Harrisburg-Carlisle, PA | 2,900 | 1.003 | $73,800 | 53% | 18% |
| Nashville-Davidson–Murfreesboro–Franklin, TN | 2,700 | 0.296 | $86,500 | 59% | 17% |
| San Antonio-New Braunfels, TX | 2,600 | 0.246 | $78,900 | 50% | 13% |
| Phoenix-Mesa-Scottsdale, AZ | 2,300 | 0.107 | $97,100 | 69% | 22% |
| Jacksonville, FL | 2,000 | 0.282 | $78,500 | 52% | 14% |
| Minneapolis-St. Paul-Bloomington, MN-WI | 1,900 | 0.1 | $90,500 | 62% | 20% |
| Louisville/Jefferson County, KY-IN | 1,900 | 0.298 | $79,600 | 60% | 13% |
| Denver-Aurora-Lakewood, CO | 1,900 | 0.127 | $91,300 | 55% | 14% |
| St. Louis, MO-IL | 1,900 | 0.126 | $84,700 | 51% | 13% |
| San Diego-Carlsbad, CA | 1,800 | 0.117 | $86,600 | 67% | 28% |
| Columbus, OH | 1,800 | 0.176 | $72,500 | 61% | 18% |
| Memphis, TN-MS-AR | 1,700 | 0.272 | $77,700 | 69% | 22% |
| Buffalo-Cheektowaga-Niagara Falls, NY | 1,600 | 0.286 | $89,900 | 62% | 21% |
| Fayetteville-Springdale-Rogers, AR-MO | 1,500 | 0.632 | $91,600 | 55% | 17% |
| Cincinnati, OH-KY-IN | 1,500 | 0.137 | $70,200 | 57% | 13% |
| Milwaukee-Waukesha-West Allis, WI | 1,500 | 0.179 | $84,800 | 46% | 11% |
| Kansas City, MO-KS | 1,400 | 0.126 | $76,500 | 63% | 19% |
| Allentown-Bethlehem-Easton, PA-NJ | 1,300 | 0.312 | $75,400 | 61% | 19% |
| Rochester, NY | 1,300 | 0.244 | $72,200 | 57% | 18% |
| Manchester-Nashua, NH | 1,300 | 1.111 | $78,200 | 53% | 14% |
| Albany-Schenectady-Troy, NY | 1,200 | 0.275 | $82,100 | 65% | 23% |
| Burlington-South Burlington, VT | 1,200 | 0.983 | $81,200 | 65% | 15% |
| Baton Rouge, LA | 1,200 | 0.3 | $71,500 | 51% | 16% |
| Sacramento–Roseville–Arden-Arcade, CA | 1,200 | 0.112 | $87,800 | 68% | 21% |
| New Haven-Milford, CT | 1,200 | 0.362 | $79,800 | 66% | 23% |
| Ann Arbor, MI | 1,000 | 0.538 | $68,500 | 64% | 25% |
| New Orleans-Metairie, LA | 1,000 | 0.167 | $70,600 | 61% | 23% |
| Oklahoma City, OK | 1,000 | 0.147 | $72,800 | 64% | 27% |
| Tulsa, OK | 900 | 0.188 | $74,300 | 63% | 24% |
| Charlottesville, VA | 900 | 0.768 | $49,500 | 58% | 10% |
| Little Rock-North Little Rock-Conway, AR | 800 | 0.24 | $67,600 | 62% | 17% |
| Gainesville, FL | 800 | 0.592 | $71,600 | 67% | 27% |
| Greensboro-High Point, NC | 800 | 0.209 | $80,500 | 63% | 24% |
| Virginia Beach-Norfolk-Newport News, VA-NC | 700 | 0.088 | $73,300 | 59% | 24% |
| Omaha-Council Bluffs, NE-IA | 700 | 0.144 | $90,400 | 61% | 18% |
| Birmingham-Hoover, AL | 700 | 0.124 | $80,900 | 62% | 22% |
| Erie, PA | 700 | 0.48 | $89,100 | 75% | 21% |
| Greenville-Anderson-Mauldin, SC | 600 | 0.158 | $84,800 | 59% | 18% |
| Indianapolis-Carmel-Anderson, IN | 600 | 0.064 | $71,700 | 57% | 21% |

