More than 157 million Americans are part of the U.S. workforce, and many of them (but not all) will spend the Labor Day holiday weekend away from their desks, assembly lines and checkout counters. As we mark the day, here’s what we know about who American workers are, what they do and the U.S. working environment in general.
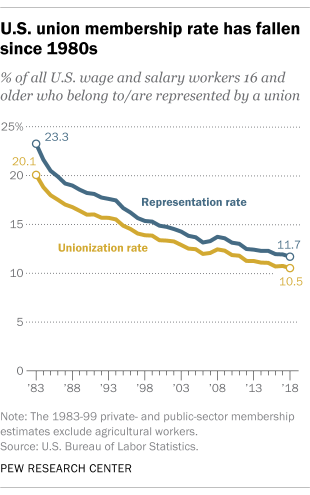
Over the past 35 years, the share of American workers who belong to labor unions has fallen by about half. Union membership peaked in 1954 at nearly 35% of all U.S. workers (excluding the self-employed), but in 2018 the unionization rate was just 10.5%. (The share of workers represented by unions is a bit higher, 11.7%, because about 1.6 million workers who aren’t union members are in jobs covered by a union contract.) The actual number of union members was 14.7 million last year, according to the Bureau of Labor Statistics (BLS). In 2012, union membership hit its lowest point since the current data series began in the early 1980s, falling below 14.4 million, before turning modestly upward.
The industry with the biggest decline in the rate of union representation from 2000 to 2018 was transportation and material moving, from 21.7% to 14.5%. This industry includes a wide swath of occupations – from air traffic controllers to bus drivers to flight attendants. Unionization rates actually have risen, albeit slightly and from low bases, in a few occupational groups: In legal occupations, for instance, the unionization rate rose from 5.1% in 2000 to 5.9% last year.
In a 2018 Pew Research Center survey, 51% of Americans said the decline in unionization has been mostly bad for working people, while 35% regarded it as mostly good. More recently, 45% of respondents in a July 2019 survey said labor unions have a positive effect on the way things are going in the country; 28% described their impact as negative.
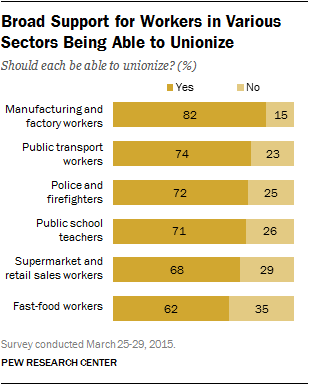
Americans generally like unions and broadly support the right of workers to unionize. A majority (55%) holds a favorable view of unions, versus 33% who hold an unfavorable view, according to the 2018 Center survey mentioned above. In a 2015 survey, large majorities said manufacturing and factory workers (82%), public transportation workers (74%), police and firefighters (72%) and public school teachers (71%) should have the right to unionize. About six-in-ten (62%) said fast-food workers should be able to unionize, while 35% were opposed.
Union members overall earned more than non-union members in 2018 – $1,051 per week at the median compared with $860 among full-time workers. The gap in earnings reflects many factors, including differences in industry and occupation, firm size and region.
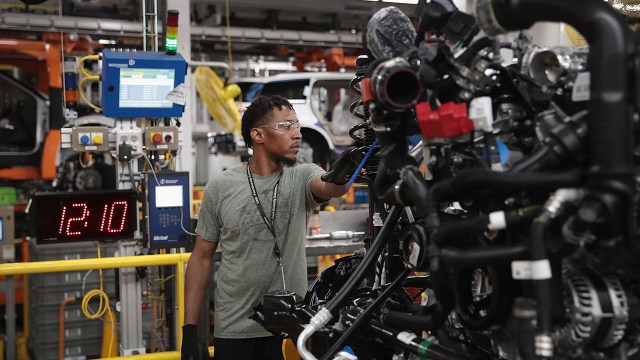
Most American workers are employed in the service sector. As of July, 107.8 million people (71% of all nonfarm payroll employees) worked in private service-providing industries, according to the BLS’s most recent employment report. Among the major service-industry sectors, the biggest was trade, transportation and utilities (27.8 million workers), followed by education and health services (24.3 million), professional and business services (21.5 million) and leisure and hospitality (16.7 million). Outside of the private sector service industry, about 22.5 million Americans worked in government in July, with nearly two-thirds at the local level. Nearly 12.9 million Americans worked in manufacturing.
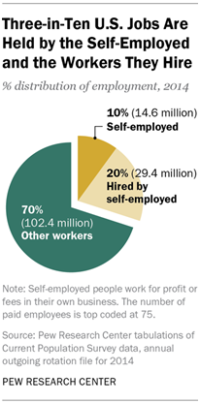
About 16 million Americans are self-employed, according to BLS data from July of this year. But the impact of the self-employed is wider: A Pew Research Center report found that self-employed Americans and the people working for them together accounted for 30% of the nation’s workforce, or 44 million jobs in total in 2014. Only about a quarter of self-employed people (3.4 million) had employees of their own, though, and those who did have workers didn’t have very many: Among self-employed people with employees, the median in 2014 was three and the average was 8.6.
The BLS estimate, derived from a survey of households, may undercount the self-employed. According to the Internal Revenue Service, there were 25.5 million nonfarm sole proprietorships in 2016 (these are all unincorporated businesses) – a count based on Schedule C filings of profit or loss from business.
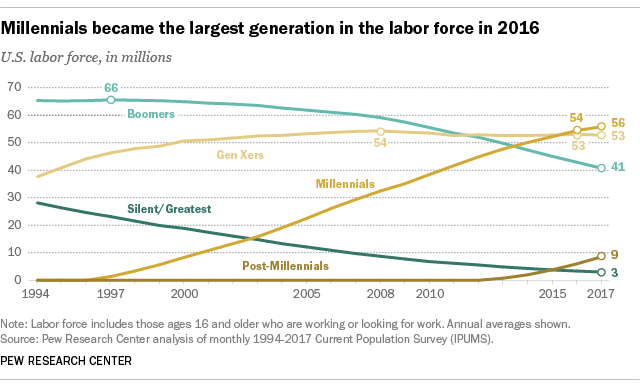
Millennials are now the largest generation in the U.S. labor force. Roughly a third of Americans in the labor force (35%, or 56 million) are Millennials – those ages 23 to 38 in 2019. In 2016, Millennials surpassed Generation Xers (ages 39 to 54 in 2019) to become the single largest generational group in the U.S. labor force. Compared with Baby Boomers, Gen Xers’ place as the dominant generation within the labor force was very short-lived – just three years.
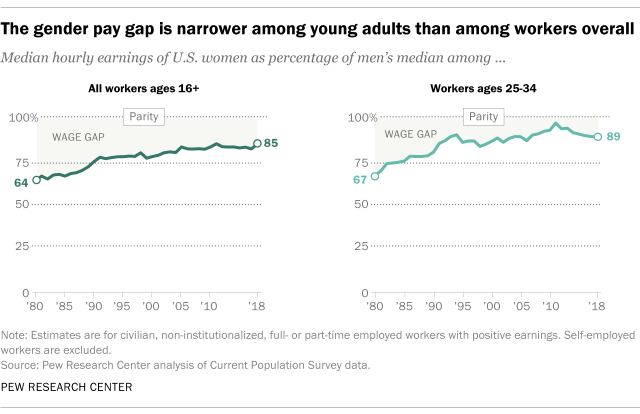
American women earn 85 cents on the dollar compared with men, but that gap is narrower among younger workers. In 2018, among workers ages 25 to 34, women’s earnings were 89% those of men, according to a Pew Research Center analysis of median hourly wages that includes full- and part-time workers. But evidence suggests that as women enter the responsibilities of parenthood their earnings fall further behind same-aged male counterparts. Several other factors are believed to contribute to the persistence of the gender wage gap, among them the impact of broader family caregiving responsibilities, differences in the industries and occupations in which women and men work, workplace gender discrimination, and differences in workforce experience.
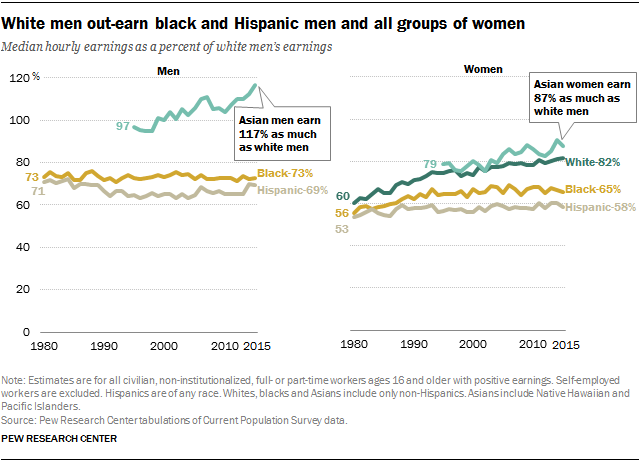
The gender gap is just one of several gaps in earnings that characterize the American workforce. A separate Center analysis from 2016, for example, found that white men had higher median hourly earnings ($21) than every other racial or ethnic and gender subgroup except one: Asian men, whose median hourly earnings were $24.
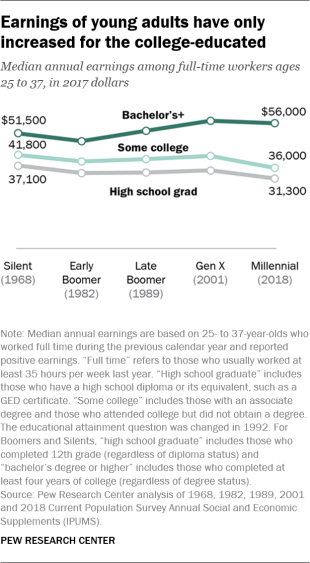
The wage gap between young workers with college degrees and their less-educated counterparts is the widest in decades. Despite the pressures of academic life, soaring college costs and burdensome student loans, young college graduates were better off than their degreeless peers on many measures of economic well-being and career attainment, and to a greater extent than in the past. The Center’s most recent analysis found that the median salary for college graduates ages 25 to 37 working full time earned was about $24,700 more annually than employed young adults holding only a high school diploma. The pay gap was significantly smaller in previous generations.
While unemployment among all groups has fallen since the depths of the Great Recession to levels not seen since the 1960s, it’s still true that the higher someone’s educational attainment is, the more likely they are to have a job. In July, according to BLS data, only 2.2% of adults with a bachelor’s degree or higher were unemployed, versus 3.6% for adults with only a high school diploma and 5.1% for adults who didn’t graduate from high school.
A much smaller share of U.S. teens work today compared with earlier decades. Teens spend 26 minutes a day, on average, doing paid work during the school year, compared with 49 minutes about a decade ago and 57 minutes in the mid-1990s, according to a recent Pew Research Center analysis of time use data from the BLS.
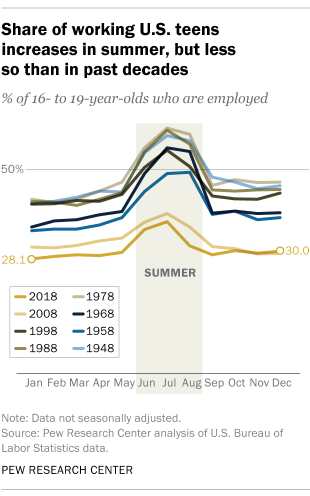
Teens also are working less during the summer. As recently as two decades ago, roughly half of U.S. teens could expect to be working for at least part of their summer vacation. But the share of teens working summer jobs has dwindled since the early 1990s: After bottoming out in 2010 and 2011 at 29.6%, the teen summer employment rate began rising again but was still only 34.6% in summer 2017. (From 1940 through the late 1980s, the teen summer employment rate generally fluctuated between 46% and 58%.) The decline of teens in summer jobs reflects an overall decline in youth employment in recent decades, a trend that’s also been observed in other advanced economies.
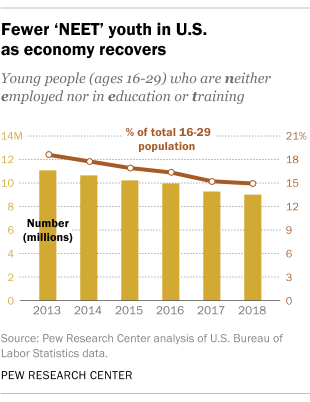
Another way of looking at youth employment, or the lack thereof, is by focusing on “NEETs” – that is, young people who are neither employed nor in education or training. In 2018, 14.8% of all Americans ages 16 to 29 – or about 9 million young people – were NEETs. In 2013, the first year for which comparable data is available, there were about 11 million NEETs in the U.S., or 18.5% of the 16-to-29 population. The Center’s 2016 analysis found that in the U.S., the NEET youth population is more female than male (57% to 43%). Two-thirds of U.S. NEETs have a high-school education or less, and black and Hispanic 16- to 29-year-olds were more likely than whites and Asians to be NEETs.
More older Americans are working than in previous decades. In July of this year, 19.8% of U.S. adults ages 65 and older – nearly 10.5 million people – reported being employed full- or part-time, continuing a steady increase since at least 2000. Older workers represented 6.6% of all employed Americans in July, up from 3% in July 2000.
Americans ages 55 and older are working at much higher rates than in July 2007, shortly before the Great Recession hit. Employment rates have recovered for adults younger than 55, but have not exceeded pre-recession levels.
A Pew Research Center analysis of 2018 labor force data found that 29% of Boomers ages 65 to 72 were working or looking for work – outpacing the labor market engagement of the Silent Generation (21%) and the Greatest Generation (19%) when they were the same age.
Raising the federal minimum wage is popular overall, but there’s a sharp partisan divide on the issue. Overall, 67% of Americans favor increasing the federal minimum wage from $7.25 an hour to $15, according to a Pew Research Center survey from earlier this year. But there’s a stark divide between Democrats and Democratic-leaning independents, 86% of whom favor the idea, and Republicans and Republican leaners, 57% of whom oppose it.
In 2018, 1.7 million workers – 2.1% of all hourly paid workers – had wages at or below the current federal minimum wage, according to the BLS. Twenty-nine states, plus the District of Columbia and many cities and counties, have set their own higher minimums. But wide disparities in the cost of living in different parts of the country – and even within individual states – complicate the policy debate.
Note: This is an update of a post originally published Sept. 3, 2015.
