
A new report from the Congressional Budget Office likely will fuel both sides of the minimum-wage debate — those who see it as a valuable weapon against poverty and inequality and those who dismiss it as irrelevant at best and a job-killer at worst.
The CBO projects that raising the federal minimum wage, now $7.25 an hour, to $10.10 by 2016 would raise incomes for 16.5 million low-wage workers, but also would cost about 500,000 workers their jobs. The office also estimated that such an increase would move a net 900,000 people above the poverty threshold — out of the roughly 45 million who are projected to be below poverty in 2016 should current law not change.
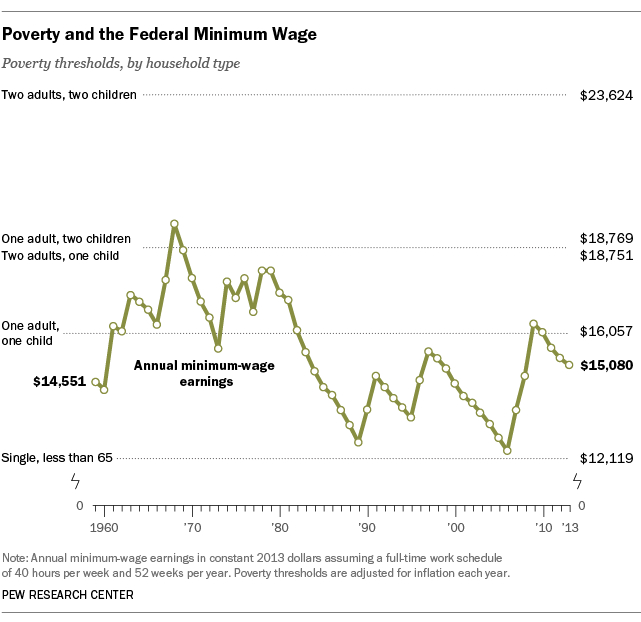
Analyzing the interplay between the minimum wage and poverty is complicated by the fact that there isn’t just one poverty threshold. The Census Bureau calculates 48 different thresholds, based on different combinations of age, family size and number of children in a household. Because the thresholds are indexed to inflation but the federal minimum is not, its real value relative to any given threshold tends to fall unless and until Congress raises it. In the chart above, for instance, the spikes in 1990-91, 1996-97 and 2007-09 reflect the most recent statutory increases. (21 states and the District of Columbia have established their own minimums higher than the federal level; of those, 10 are indexed to inflation.)
The chart compares the federal minimum to the poverty thresholds for five different household types. (We used the Consumer Price Index for All Urban Consumers, Research Series, to adjust the wage levels.) For example, in 1968, when the minimum wage was at its peak value, one minimum-wage job could keep three people out of poverty. Today’s minimum, which works out to $15,080 a year (assuming a full 40-hour work week), will lift a single person out of poverty. However, it’s nearly $1,000 below the poverty threshold for a one-adult, one-child household.
Along with being fodder for political debate, the CBO report demonstrates the complex dynamics of the U.S. labor market, in which a positive change for one group often creates a negative offset for some other group. For instance, the CBO estimates that under the “$10.10 option” real income for the poorest workers (those earning less than the poverty threshold to three times the threshold) would rise by a collective $17 billion by 2016. But that would be offset by a $17 billion decrease in real incomes among affluent families (those with incomes six times the poverty threshold — roughly $150,000 for a family of four), mainly because of higher prices and lower business incomes. When all the pluses and minuses are taken into account, overall real incomes would rise by $2 billion.
