Pew Research Center conducted this study to better understand the growing role and changing demographic characteristics of the older workforce in the U.S. (that is, employed adults ages 65 and older). In addition to wages and hours, we also analyzed other job characteristics such as employer-provided benefits and self-employment.
The analysis in this report is based on two separate data sources. Most of the earnings, hours and employment characteristics comes from the U.S. Census Bureau’s Current Population Survey. The findings on employment and retirement and on participation in gig activities are from the Federal Reserve’s 2022 Survey of Household Economics and Decisionmaking.
Read more about the report’s methodology.
An older worker refers to an employed person age 65 or older.
A younger worker refers to an employed person age 25 to 64.
The workforce refers to the employed population ages 16 and older.
The labor force includes all who are employed and those who are unemployed but looking for work.
Full-time work is defined as 35 hours a week or more.
References to White, Black and Asian Americans include those who report being only one race and are not Hispanic. Hispanics are of any race. The Current Population Survey did not include Asian as a separate racial category until 2003, and data for Hispanics is not available until 1971.
Roughly one-in-five Americans ages 65 and older (19%) were employed in 2023 – nearly double the share of those who were working 35 years ago.
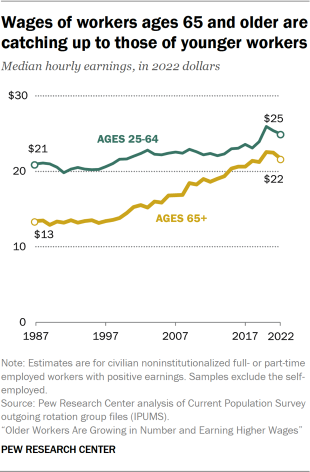
Not only are older workers increasing in number, but their earning power has grown in recent decades. In 2022, the typical worker age 65 or older earned $22 per hour, up from $13 in 1987.
Earnings for younger workers haven’t grown as much. As a result, the wage gap between older workers and those ages 25 to 64 has narrowed significantly.
Linked to their higher wages, today’s older workers are different from older workers of the past in other important ways:
- They’re working more hours, on average, than in previous decades. Today, 62% of older workers are working full time, compared with 47% in 1987.
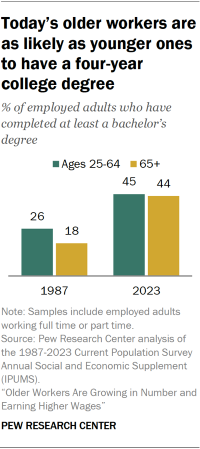
- They’re more likely to have a four-year college degree than in the past. Some 44% of older workers today have a bachelor’s degree or more education, compared with 18% in 1987. That puts them about on par with workers ages 25 to 64.
- They’re more likely than in previous decades to be receiving employer-provided benefits such as pension plans and health insurance. The same does not hold true for younger workers, whose access to these employer-provided benefits has decreased in recent decades. For example, among workers ages 65 and older, 36% now have the option to participate in an employer- or union-sponsored retirement plan (either an old-style pension or a 401(k)-type plan), up from 33% in 1987. Only 41% of younger workers have access to this type of retirement plan at work, down from 55% in 1987.
Continuing a longstanding trend, older workers are more than twice as likely as younger workers to be self-employed (23% are, compared with 10% of workers ages 25 to 64).
Taking all these factors into account – more older adults in the workforce, working longer hours with higher levels of education and greater pay per hour – older workers’ overall contribution to the labor force has grown quite a bit. In 2023, they accounted for 7% of all wages and salaries paid by U.S. employers. That is more than triple the share in 1987 (2%).
A recent Pew Research Center survey found that workers ages 65 and older are more satisfied with their jobs overall than younger workers. They’re also more likely to say they find their job enjoyable and fulfilling all or most of the time, and less likely to say they find it stressful.
In addition to the key findings covered in this overview, the two sections that follow provide more detail on:
Gender, race and the older workforce
The demographic makeup of the U.S. workforce overall has changed substantially in recent decades. Some of those changes reflect broader societal shifts – like more women entering the labor force and going to college. Others are tied to the changing racial and ethnic makeup of the country. These trends can be seen across the older and younger workforces.
By gender
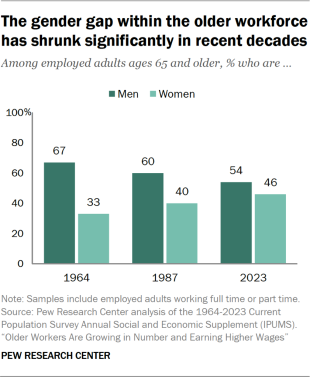
Women make up a larger share of the older workforce than they have in the past. Today, women represent 46% of all workers ages 65 and older. By comparison, their share was 40% in 1987 and 33% in 1964.
This trend mirrors the pattern seen among younger workers: Women now make up 47% of employed adults ages 25 to 64, up from 44% in 1987 and 33% in 1964.
In addition, older women who are working today are much more likely than their predecessors to have a four-year college degree: 42% do, compared with only 12% of working older women in 1987. Within the older workforce, women are now about as likely as men to have a bachelor’s degree or more education: 42% and 45% do, respectively.
When it comes to the younger workforce today, women are more likely than men to have a bachelor’s degree or more education. Among workers ages 25 to 64, 49% of women have a four-year college degree, compared with 41% of men.
In years past, men were more likely than women to have a college degree within both the older and younger workforces.
Overall, educational attainment gains among women in the older and younger workforces are likely attributed to growing shares of women getting a four-year college degree over the past few decades. In fact, there are now more women than men among all college-educated workers.
By race and ethnicity

The young adult population is at the forefront of racial and ethnic change in the U.S., and the demographics of the labor force reflect that.
Majorities of both the older and younger workforces are White, but those shares have declined from previous decades. Meanwhile, shares of Black and Hispanic adults have risen within both workforces since 1987.
Still, the younger workforce remains more racially and ethnically diverse. Today, 59% of workers ages 25 to 64 are White, compared with 75% of those 65 and older. And 19% of workers among the younger workforce are Hispanic, compared with 9% of older workers.
In addition, a greater share of younger workers today are foreign born: 20%, compared with 16% of older workers. (Data on shares of foreign- and native-born adults is not available prior to 1994.)