The American Trends Panel survey methodology
Overview
The American Trends Panel (ATP), created by Pew Research Center, is a nationally representative panel of randomly selected U.S. adults. Panelists participate via self-administered web surveys. Panelists who do not have internet access at home are provided with a tablet and wireless internet connection. Interviews are conducted in both English and Spanish. The panel is being managed by Ipsos.
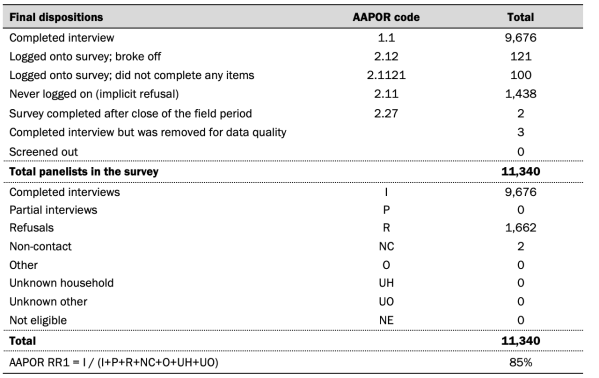
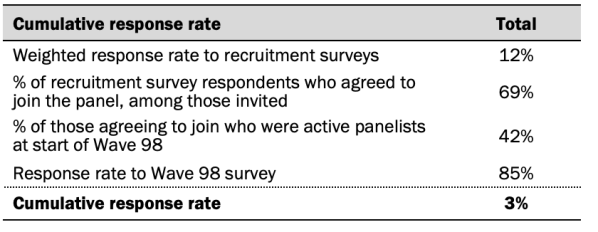
Data in this report is drawn from the panel wave conducted from Oct. 18 to Oct. 24, 2021. A total of 9,676 panelists responded out of 11,340 who were sampled, for a response rate of 85%. The cumulative response rate accounting for nonresponse to the recruitment surveys and attrition is 3%. The break-off rate among panelists who logged on to the survey and completed at least one item is 1%. The margin of sampling error for the full sample of 9,676 respondents is plus or minus 1.6 percentage points.
Panel recruitment
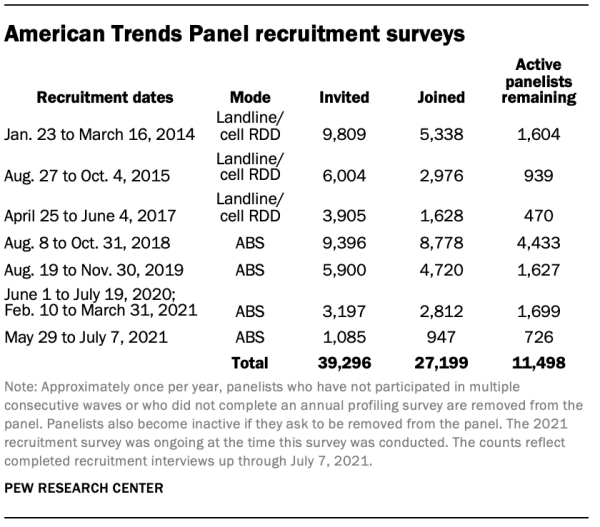
The ATP was created in 2014, with the first cohort of panelists invited to join the panel at the end of a large, national, landline and cellphone random-digit-dial survey that was conducted in both English and Spanish. Two additional recruitments were conducted using the same method in 2015 and 2017, respectively. Across these three surveys, a total of 19,718 adults were invited to join the ATP, of whom 9,942 (50%) agreed to participate.
In August 2018, the ATP switched from telephone to address-based recruitment. Invitations were sent to a stratified, random sample of households selected from the U.S. Postal Service’s Delivery Sequence File. Sampled households receive mailings asking a randomly selected adult to complete a survey online. A question at the end of the survey asks if the respondent is willing to join the ATP. Starting in 2020 another stage was added to the recruitment. Households that do not respond to the online survey are sent a paper version of the questionnaire, $5 and a postage-paid return envelope. A subset of the adults returning the paper version of the survey are invited to join the ATP. This subset of adults receive a follow-up mailing with a $10 pre-incentive and invitation to join the ATP.
Across the four address-based recruitments, a total of 19,578 adults were invited to join the ATP, of whom 17,257 agreed to join the panel and completed an initial profile survey. In each household, the adult with the next birthday was asked to go online to complete a survey, at the end of which they were invited to join the panel. Of the 27,199 individuals who have ever joined the ATP, 11,498 remained active panelists and continued to receive survey invitations at the time this survey was conducted.
The U.S. Postal Service’s Delivery Sequence File has been estimated to cover as much as 98% of the population, although some studies suggest that the coverage could be in the low 90% range.10 The American Trends Panel never uses breakout routers or chains that direct respondents to additional surveys.
Sample design
The overall target population for this survey was non-institutionalized persons ages 18 and older, living in the U.S., including Alaska and Hawaii.
This study featured a stratified random sample from the ATP. The sample was allocated according to the following strata, in order: tablet households, foreign-born Hispanics, U.S.-born Hispanics, not registered to vote, high school education or less, foreign-born Asian Americans, people ages 18 to 34, non-Hispanic Black Americans, people who use the internet weekly or less, nonvolunteers and all other categories not already falling into any of the above. Respondent weights are adjusted to account for differential probabilities of selection as described in the Weighting section below.
Questionnaire development and testing
The questionnaire was developed by Pew Research Center in consultation with Ipsos. The web program was rigorously tested on both PC and mobile devices by the Ipsos project management team and Pew Research Center researchers. The Ipsos project management team also populated test data that was analyzed in SPSS to ensure the logic and randomizations were working as intended before launching the survey.
Incentives
All respondents were offered a post-paid incentive for their participation. Respondents could choose to receive the post-paid incentive in the form of a check or a gift code to Amazon.com or could choose to decline the incentive. Incentive amounts ranged from $5 to $20 depending on whether the respondent belongs to a part of the population that is harder or easier to reach. Differential incentive amounts were designed to increase panel survey participation among groups that traditionally have low survey response propensities.
Data collection protocol
The data collection field period for this survey was Oct. 18 to Oct. 24, 2021. Postcard notifications were mailed to all ATP panelists with a known residential address on Oct. 18.
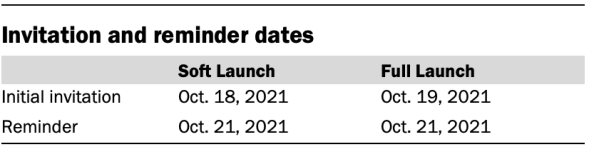
Invitations were sent out in two separate launches: Soft Launch and Full Launch. Sixty panelists were included in the soft launch, which began with an initial invitation sent on Oct. 18, 2021. The ATP panelists chosen for the initial soft launch were known responders who had completed previous ATP surveys within one day of receiving their invitation. All remaining English- and Spanish-speaking panelists were included in the full launch and were sent an invitation on Oct. 19.
All panelists with an email address received an email invitation and up to one email reminder if they did not respond to the survey. All ATP panelists that consented to SMS messages received an SMS invitation and up to one SMS reminder.
Data quality checks
To ensure high-quality data, the Center’s researchers performed data quality checks to identify any respondents showing clear patterns of satisficing. This includes checking for very high rates of leaving questions blank, as well as always selecting the first or last answer presented. As a result of this checking, three ATP respondents were removed from the survey dataset prior to weighting and analysis.
Weighting
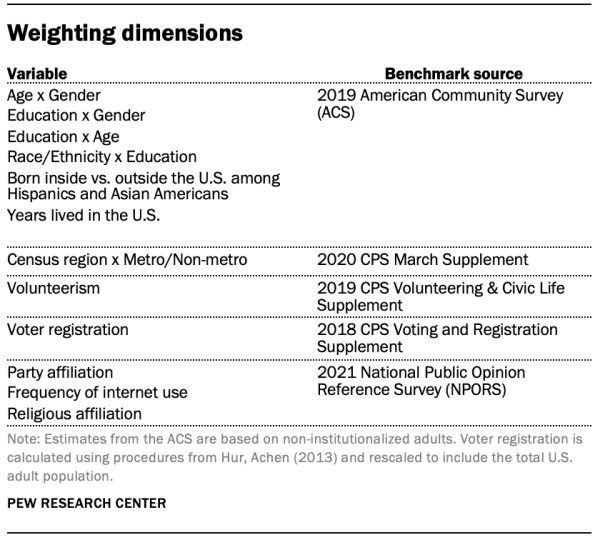
The ATP data is weighted in a multistep process that accounts for multiple stages of sampling and nonresponse that occur at different points in the survey process. First, each panelist begins with a base weight that reflects their probability of selection for their initial recruitment survey. The base weights for panelists recruited in different years are scaled to be proportionate to the effective sample size for all active panelists in their cohort and then calibrated to align with the population benchmarks in the accompanying table to correct for nonresponse to recruitment surveys and panel attrition. If only a subsample of panelists was invited to participate in the wave, this weight is adjusted to account for any differential probabilities of selection.
Among the panelists who completed the survey, this weight is then calibrated again to align with the population benchmarks identified in the accompanying table and trimmed at the 1st and 99th percentiles to reduce the loss in precision stemming from variance in the weights. Sampling errors and tests of statistical significance take into account the effect of weighting.
Some of the population benchmarks used for weighting come from surveys conducted prior to the coronavirus outbreak that began in February 2020. However, the weighting variables for panelists recruited in 2021 were measured at the time they were recruited to the panel. Likewise, the profile variables for existing panelists were updated from panel surveys conducted in July or August 2021.
This does not pose a problem for most of the variables used in the weighting, which are quite stable at both the population and individual levels. However, volunteerism may have changed over the intervening period in ways that made their 2021 measurements incompatible with the available (pre-pandemic) benchmarks. To address this, volunteerism is weighted using the profile variables that were measured in 2020. For all other weighting dimensions, the more recent panelist measurements from 2021 are used.
For panelists recruited in 2021, plausible values were imputed using the 2020 volunteerism values from existing panelists with similar characteristics. This ensures that any patterns of change that were observed in the existing panelists were also reflected in the new recruits when the weighting was performed.
The following table shows the unweighted sample sizes and the error attributable to sampling that would be expected at the 95% level of confidence for different groups in the survey.
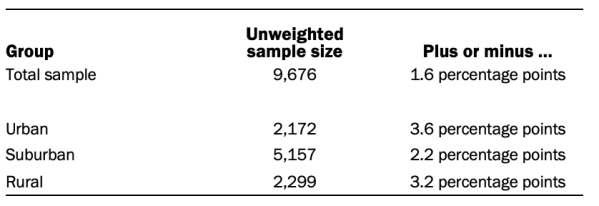
Sample sizes and sampling errors for other subgroups are available upon request. In addition to sampling error, one should bear in mind that question wording and practical difficulties in conducting surveys can introduce error or bias into the findings of opinion polls.
Dispositions and response rates
Adjusting income and defining income tiers
To create upper-, middle- and lower-income tiers, respondents’ 2020 family incomes were adjusted for differences in purchasing power by geographic region and household size. “Middle-income” adults live in families with annual incomes that are two-thirds to double the median family income in the panel (after incomes have been adjusted for the local cost of living and household size). The middle-income range for the American Trends Panel is about $42,000 to $125,900 annually for an average family of three. Lower-income families have incomes less than roughly $42,000, and upper-income families have incomes greater than roughly $125,900 (all figures expressed in 2020 dollars).
Based on these adjustments, 31% of respondents are lower income, 47% are middle income and 16% fall into the upper-income tier. An additional 6% either didn’t offer a response to the income question or the household size question.
For more information about how the income tiers were determined, please see here.
A note about the Asian sample
This survey includes a total sample size of 329 Asian Americans. The sample includes English-speaking Asian Americans only and, therefore, may not be representative of the overall Asian American population (75% of our weighted Asian American sample was born in another country, compared with 77% of the Asian American adult population overall). Despite this limitation, it is important to report the views of Asian Americans on the topics in this study. As always, Asian Americans’ responses are incorporated into the general population figures throughout this report. Because of the relatively small sample size and a reduction in precision due to weighting, we are not able to analyze Asian American respondents by demographic categories, such as gender, age or education. For more, see “Polling methods are changing, but reporting the views of Asian Americans remains a challenge.”
Categorization of COVID-19 county health impact
This report uses the number of deaths attributed to COVID-19 in each respondent’s county in the eight weeks prior to the survey as a measure of the scale of the health impact of the outbreak for each individual in the survey. Some small counties have been combined into single reporting units in the data. Deaths recorded in these aggregate units are assigned to each constituent county proportional to that county’s population. County death totals are then adjusted for differences in county population (per 100,000 residents). Counties are categorized as having a higher, medium, or lower rate of COVID-19 deaths.
Counties are classified as “higher” if they had 25 deaths or more per 100,000 people in the eight weeks prior to Oct. 18, 2021. “Medium” counties had between 10 and 24.99 deaths per 100,000 people. “Lower” counties had fewer than ten deaths per 100,000 people during this eight-week period.
Data for deaths attributed to COVID-19 by county are taken from the 2019 Novel Coronavirus COVID-19 (2019-nCoV) Data Repository maintained at John Hopkins University (downloaded on Nov. 5, 2021).
© Pew Research Center, 2021