When Americans were asked to describe their race and ethnicity in their own words, most provided answers that correspond to standard Census Bureau categories. And when they answered questions about their race and ethnicity similar to those asked in the 2020 census, most respondents chose categories that matched their self-description, according to the Pew Research Center survey.
But only about half of Americans said the census question reflects how they see their own race and origin “very well.” The share who did not think so was higher for Hispanic adults than for White or Black adults.
The 2020 census asked for new details from White and Black respondents
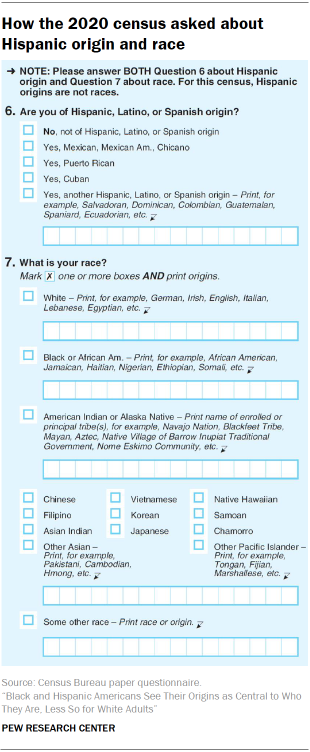
The 2020 census asked about Hispanic origin and race in a two-part format, similar to that in use since 1980. First, respondents were asked whether or not they were Hispanic or Latino, and to check or write in their origin if so. Next, they were asked to mark one or more boxes to identify their race and to fill in origin information if it was not included among the options. On the 2020 questionnaire, White and Black respondents were offered a write-in box for origin detail for the first time.
Every census since the first one in 1790 has asked about race, in ways that varied with the times. Starting in 1960, respondents could choose the racial categories that describe them on the census and in census surveys, rather than have census workers do it for them. The information from statistics on race and Hispanic origin is used in administering government programs and devising policies to carry out laws related to equal opportunity, design programs for specific groups and analyze social change.
Nearly one-in-five did not answer when asked to describe their race or ethnicity
Some respondents push back against being asked about their race or ethnicity
When asked to describe their race or ethnicity in their own words, a small share of respondents (3%) gave answers that directly or indirectly questioned the question.
Some protested that “we shouldn’t even have to answer this question” or “I believe that is the cause of most racism in the world, having to be segregated into groups” or “stupid question.” Others framed it as “I am a human like everyone else” or “To me, everybody is equal.” Some gave irrelevant responses such as “taxpayer” or “great.”
On census forms and surveys, the Census Bureau considers these answers “uncodable,” so they are not included in categories that are analyzed.
Other researchers have found that asking questions about race and ethnicity can be sensitive for some respondents.
Race and Hispanic origin data are on the census, according to the Census Bureau, because they are required in order to help federal agencies enforce civil rights laws. Due to protests, though, the Census Bureau has researched eliminating some questions that respondents do not like to answer, especially if there are other sources of this information. For example, a question about flush toilets was dropped from the agency’s American Community Survey in 2016. Another question, asking respondents what time they leave for work, was modified to be less intrusive.
When asked in the January 2020 Pew Research Center survey to describe their race or ethnicity in their own words, about eight-in-ten survey respondents gave responses that fit into categories on the two-part Census Bureau question about Hispanic origin and race.
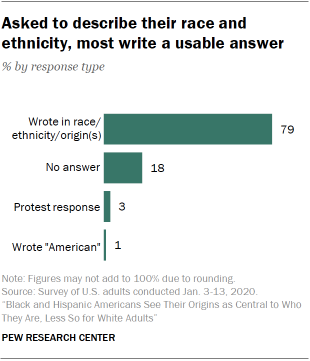
However, a notable share – 18% – did not fill in an answer. And 3% provided answers, ranging from “human race” to “no” to “none of your business,” which could be construed as a protest of the question.
Younger respondents were most likely not to provide any answer when asked to describe their race or ethnicity: 20% of those ages 18 to 49 said nothing, compared with 14% of those ages 50 and older.
Another 1% of respondents wrote in “American,” which the Census Bureau does not code as a standard race or ethnicity response, but which makes up a growing share of responses to questions about ancestry or ethnicity on its surveys. As the Census Bureau acknowledges, “There are many reasons why people may report their ancestors as American.”
Respondents who answered the two-part Census Bureau question by saying they were single-race non-Hispanic White (83%) were more likely than Hispanic respondents (78%) to provide an answer on the self-description question that corresponded to an official census category. Eight-in-ten Black respondents (80%) provided a self-description that corresponded to a census category.
Did answers to both questions match?
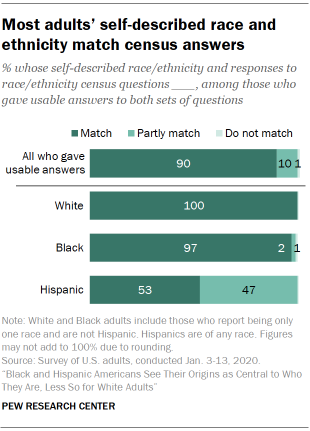
For most U.S. adults who took part in the survey, their self-description of their race and Hispanic origin matched how they answered the two-step Census Bureau ethnicity and race questions.
Among respondents who offered usable answers to both questions, 90% had responses that matched entirely. An additional 10% gave answers that partially matched, for example, describing themselves with multiple races in one question but one race in another. A small share, about 1%, gave responses that did not match. (Numbers add to more than 100% due to rounding of underlying data.)
White and Black respondents were more likely than Hispanics to have matched responses to the two sets of questions. Among those who gave usable responses to both sets of questions, all White respondents and 97% of Black respondents provided totally matched answers, compared with 53% of Hispanic respondents.
Hispanic respondents were more likely than White or Black respondents to have a partial match. This may be because the 2020 census form instructed respondents that Hispanic origins are not a race, and required everyone to select a race, but many Hispanics consider Hispanic to be their race.
Respondents who checked a single race on the census question (92%) were more likely than those who checked multiple races (55%) to have their answers match exactly with their self-descriptions. Those who checked multiple races were more likely to have a partial match (43% vs. 8%).
Most respondents had matched answers to both the self-description and census questions even when counting those who provided no response or a response that could not be coded into a census category. Among all respondents, 70% gave matching answers to both questions and 8% gave answers that partially matched.
An additional 22% did not provide a usable response to the self-description question or the two-part census question, meaning that they did not offer an answer that could be categorized into a standard race or ethnicity group. (This included about 2% of respondents who did not answer the census race question and 3% who did not answer the census Hispanic-origin question.)
A small fraction, less than 1%, provided answers that did not match, such as providing one race in the self-description and another in the census question.
Demographic differences in views of how census questions reflect identity
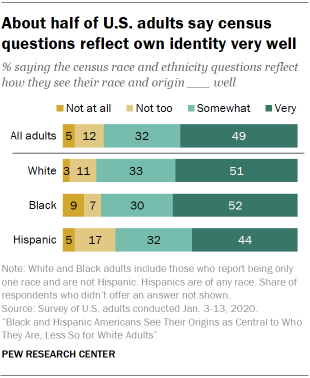
In all, about half of Americans (49%) said the two questions similar to those in the 2020 census asked in the survey reflect how they see their race and origin very well. Roughly a third (32%) said the questions do so somewhat well. The remaining 17% said the census questions reflect their self-identity not too well (12%) or not at all well (5%).
About half of White and Black adults said the census questions describe them very well. Among Hispanic adults, 44% did. Hispanic respondents were more likely than White or Black respondents to say the questions describe them “not too well” or “not well at all.”
However, foreign-born Hispanic respondents were more likely than U.S.-born Hispanics to say the questions reflect their race and origin very well (52% to 38%). There was no difference in attitudes about the census questions between single-race and multiple-race respondents.
Views about the census questions also differed by age, with 54% of Americans ages 50 and older saying the census questions reflect their identity very well, compared with 45% of younger age groups.
Not surprisingly, those whose self-description entirely matched their answers to the two questions asked on the census were more likely to say the questions aligned with how they thought of themselves. But even among those with total matches, only 54% said the questions reflect “very well” how they saw their race and origin. Among those with partial matches or no match, only 40% said so. Those who said the census question described them “not too well” or “not at all well” were more likely to offer a protest answer to the self-description question: 4% did. This group also was the most likely to leave the self-description blank: 24% did.