As a group, middle-income adults look much like U.S. adults overall, in terms of their demographic and socioeconomic characteristics. By some measures, middle-income adults are more similar to all adults today than was true in 1971. For example, adults ages 65 and older were underrepresented in the middle-income population in 1971. But that is no longer the case because older adults experienced greater gains in economic status than other age groups from 1971 to 2015.
This chapter explores the demographics of middle-income adults, with some comparisons to lower-income and upper-income adults. The tables in Appendix B show the demographics of each income tier in greater detail.
As noted, “middle-income adults” are defined as those with household incomes that are between two-thirds and twice the median household income overall. These adults accounted for 50% of all adults in 2015, down from 61% in 1971. Their incomes for a three-person household ranged from about $42,000 to $126,000 in 2014.
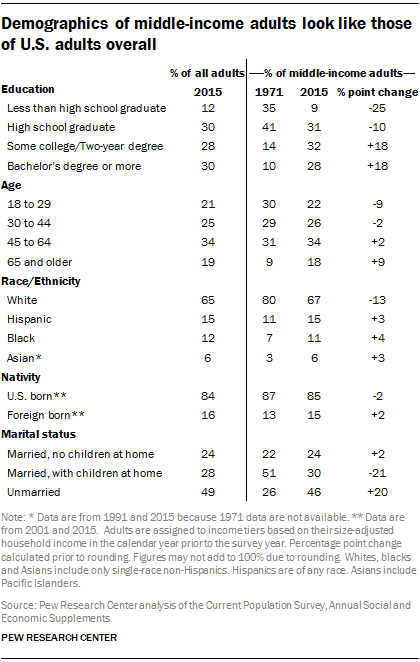
Education: As is true of U.S. adults overall, most middle-income adults now have at least some college education, but the opposite was the case in 1971. From 1971 to 2015, the share of middle-income adults with some college education or a two-year degree increased from 14% to 32%. Over the same period, the share with a bachelor’s degree or more rose from 10% to 28%. The educational attainment of middle-income adults in 2015 mirrors that of society overall. As shown in Appendix B, lower-income adults are the least likely to have at least some college education, and upper-income adults are the most likely to have at least some college education.
Age: Older adults, whose economic status improved markedly from 1971 to 2015, make up a larger share of middle-income adults today. The share of middle-income adults who are ages 65 and older doubled from 9% in 1971 to 18% in 2015. The age profile of middle-income adults now closely resembles that of adults overall. But middle-income adults (and lower-income adults) are younger than upper-income adults (see the tables in Appendix B).
Race and ethnicity: As the nation has become more racially and ethnically diverse in recent decades, so have middle-income adults. Whites are now about two-thirds of middle-income adults (67%), a decline from their 80% representation in 1971. This trend parallels the pattern for all adults, as does the increase in Hispanics and blacks as a share of middle-income adults. Hispanics, 15% of middle-income adults in 2015, were 11% of this group in 1971. Blacks, 11% of middle-income adults in 2015, were 7% in 1971. The share of Asians among middle-income adults, 6% in 2015, has doubled since 1991, the earliest year that data are available for this racial group.
Middle-income adults in 2015 were more likely to be white (67%) than lower-income adults (52%) but less likely than upper-income adults (77%). Middle-income adults in 2015 were less likely to be black or Hispanic than lower-income adults, but more likely than upper-income adults.
Nativity: As is true of the country overall, middle-income adults include a growing share of immigrants. In 2015, 15% of middle-income adults were foreign born, about the same as for all adults (16%). The share of foreign born is markedly higher for lower-income adults (22%) and slightly lower for upper-income adults (13%). Since 2001, the share of foreign born has risen slightly for the total adult population as well as for all income groups.
Marriage: The declining share of married adults in the U.S. has played a role in reshaping the makeup of middle-income adults. Unmarried adults were 26% of middle-income adults in 1971 and 46% in 2015 (slightly below their 49% representation in the overall adult population). Married adults with children at home, who were half (51%) of middle-income adults in 1971, were 30% of the category in 2015. Married adults without children at home accounted for 22% of middle-income adults in 1971, and rose slightly to 24% in 2015.
A striking difference between the income groups is in the share who are not married – 63% of lower-income adults, 46% of middle-income adults and 35% of upper-income adults. A similar pattern is true for married adults without children at home, who make up 24% of the middle-income group, higher than their 17% of lower-income adults and less than their 33% of upper-income adults. Married people with children at home make up a higher share of middle-income adults (30% in 2015) and upper-income adults (32%) than of lower-income adults (20%).
Labor market status
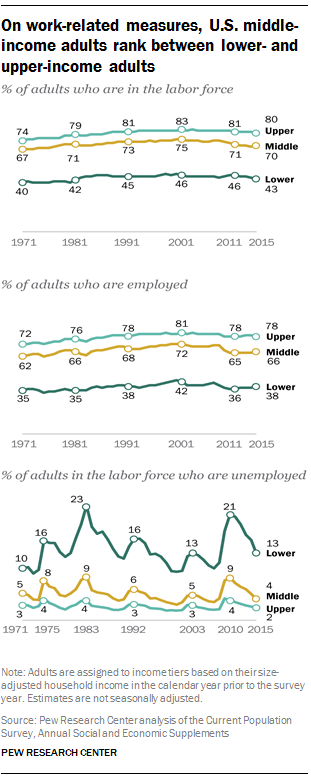
Employment status: Generally speaking, labor force participation is higher and other measures of employment are better at each step up the income ladder.39 In 2015, 70% of middle-income adults were either working or actively looking for work (the definition of who is in the labor force), compared with 43% of lower-income adults and 80% of upper-income adults. The share of adults who are employed – the employment-population ratio – ranged from 38% among lower-income adults to 66% among middle-income adults to 78% among upper-income adults.
A similar pattern exists for the unemployment rate, the share of the labor force that is without work and actively looking for work. The unemployment rate of all middle-income adults, 4% in March of 2015, was much closer to the 2% rate of upper-income adults than to the 13% rate for lower-income adults.
Unemployment rose for all income groups during the Great Recession, but lower-income adults have not recovered to the same extent as middle- and upper-income adults. The unemployment rate remains higher in 2015 for lower-income adults (13%) compared with their 10% rate in 2007, while rates for middle- and upper-income adults are the same as in 2007. The Great Recession began in December 2007 and ended in June 2009.