The dispersion of American adults out of the middle is accompanied by rising inequality. Trends in household income show rising prosperity overall from 1970 to 2014, but median income increased the most for upper-income households and by less for middle-income and lower-income households.40 That development, coupled with the more rapid growth in the number of upper-income households than of other types, pushed the share of U.S. aggregate household income held by upper-income households in 2014 to 49%, its highest level since 1970.
Overall, Americans are less well-to-do now than at the start of the 21st century. For all income tiers, median incomes in 2014 were lower than in 2000. These reversals are the result of two recessions – the downturn in 2001 and the Great Recession of 2007-09 – and economic recoveries that have been too anemic to fully repair the damage. There are signs the financial bleeding may have stopped, however, as median household income in 2014 was about the same as in 2010. But the direction ahead is uncertain as some leading economists argue that negligible or no economic growth is here to stay.41
This chapter examines changes in the incomes of America’s lower-, middle- and upper-income households from 1970 to 2014. As noted, estimates of income are adjusted for household size and scaled to reflect a three-person household. The impact of adjusting for household size on income trends is discussed in the accompanying text box. The data source is the U.S. Census Bureau’s Current Population Survey. Income represents the annual flow of what a household earns through work, receipt of interest and dividends, retirement funds and so on.42
Trends in the income of lower-, middle- and upper-income households
Long-term trends in the incomes of lower-, middle- and upper-income households lead to three key findings: households in all income tiers experienced gains in income from 1970 to 2014; the incomes of upper-income households increased the most, followed by middle-income and lower-income households, respectively; and incomes of all households increased from 1970 to 2000 but fell from 2000 to 2014.43
The impact of adjusting income for household size
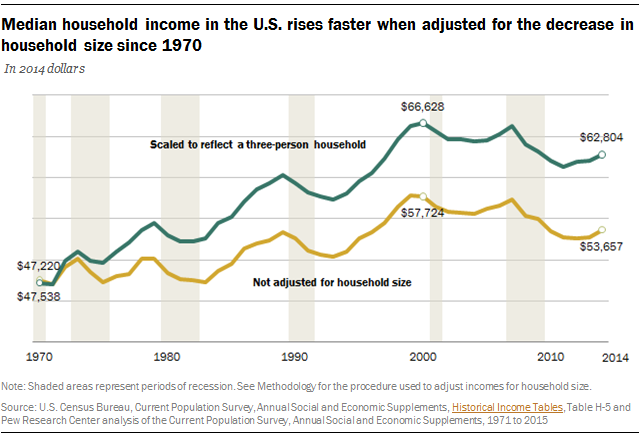
The measure of how much household income changed from 1970 to 2014 is affected by changes in the size of U.S. households. The typical household in 1970 consisted of 3.2 people; the typical household in 2015 had 2.5 people, or 21% fewer. Because smaller households can support a better standard of living with the same income as larger households, it is desirable to account for changes in the size of households when evaluating changes in their wellbeing.
Making an adjustment for household size means revising upward the income of households that are of below-average size (fewer people to support) and revising downward the income of households that are of above-average size (more people to support). In this manner, incomes are scaled up or down to arrive at an estimate of how much a household would have at its disposal if it consisted of three people, the assumed norm for household size (see Methodology for details on the method). The assumption regarding household size is for reporting purposes only. It has no impact on trends in household income or on the assignment of a household to an income tier.
According to the U.S. Census Bureau, which does not adjust incomes for household size, the median income of U.S. households rose from $47,538 in 1970 to $53,657 in 2014, or by 13%. After adjustments are made for changes in household size, the median income of U.S. households is estimated to have increased from $47,220 in 1970 to $62,804 in 2014, or by 33%. Thus, this adjustment has a substantial impact on estimates of how much the wellbeing of American households has changed over time. The greatest impact is in the 1970s, when average household size fell from 3.2 to 2.7.
Households in each income tier experienced the ups and downs of business cycles, but all stood on higher ground in 2014 than in 1970. The median income of middle-income households increased from $54,682 in 1970 to $73,392 in 2014, a gain of 34%, and the median income of lower-income households increased from $18,799 to $24,074, or by 28%. Upper-income households realized the greatest increase, from $118,617 in 1970 to $174,625 in 2014, up 47%.
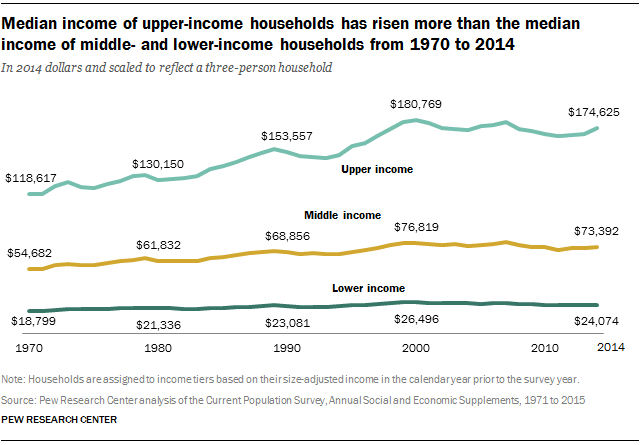
The overall income trend from 1970 to 2014 is composed of two distinct episodes – steadfast gains from 1970 to 2000 and losses from 2000 to 2014. From 1970 to 2000, the median income of middle-income households increased from $54,682 to $76,819, the median income of lower-income households increased from $18,799 to $26,496, and the median income for upper-income households rose from $118,617 to $180,769.
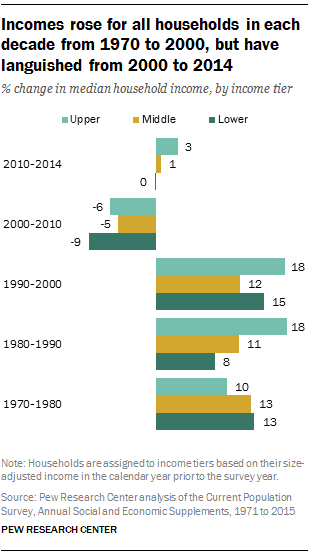
In percentage terms, households typically experienced double-digit gains in each of the three decades from 1970 to 2000. Middle-income household income increased by 13% in the 1970s, 11% in the 1980s, and 12% in the 1990s. Lower-income households had gains of 13% in the 1970s, 8% in the 1980s and 15% in the 1990s. Upper-income households registered a 10% gain in the 1970s followed by much stronger gains in later decades – 18% in both the 1980s and 1990s.
By 2014, households in all income tiers were worse off than in 2000. The median income of middle-income households fell 4% from 2000 to 2014, from $76,819 to $73,392. The loss for upper-income households was similar, at 3%. Their median income dropped from $180,769 in 2000 to $174,625 in 2014. The reversal for lower-income households was the greatest as their income fell from $26,496 to $24,074, or by 9%.
Overall, the economic stagnation that has characterized this century so far has set the welfare of households back by at least 15 years. For upper-income households, the median income in 2014 was comparable to its level in 1998. The median for middle-income households in 2014 is similar to its level in 1997, and for lower-income households the median income has retreated to its level in 1996.
Distribution of U.S. aggregate household income
The share of U.S. aggregate household income held by middle-income households has eroded significantly over time, while the share held by lower-income households has remained relatively static. Upper-income households now command the greatest share of aggregate income and are on the verge of holding more in total income than all other households combined.44 This shift is partly because upper-income households constitute a rising share of the population and partly because their incomes are increasing more rapidly than those of other tiers.
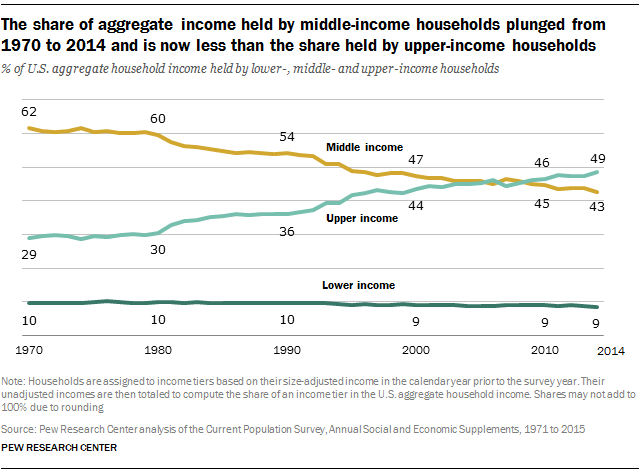
In 2014, upper-income households accounted for 49% of U.S. aggregate household income. That was more than double the share of adults living in those households (21%). Middle-income households held 43% of aggregate household income in 2014, less than the 50% share of adults living in those households. And although 29% of adults lived in lower-income households, they commanded only 9% of aggregate income.45
Over the past 45 years, the share of aggregate income held by upper-income households has risen consistently, and the share held by middle-income households has fallen just as steadily. In 1970, the upper-income tier accounted for 29% of aggregate income, the middle-income tier had a 62% share, and the lower-income tier held 10%. At the time, the share of the middle-income tier in aggregate income was about the same as its share in the adult population (61%). Upper- and lower-income households accounted for 14% and 25% of the adult population, respectively.
In the past four decades, the share of aggregate income going to upper-income households has risen by 20 percentage points – more than the 7 percentage point increase in the share of upper-income households in the adult population. Meanwhile, the share of aggregate income going to middle-income households has fallen more sharply – by 19 percentage points – than the 11 percentage point decrease in their share of the adult population. The share of aggregate income held by lower-income households has fallen by 1 percentage point despite a 4-point increase in their share in the adult population.
The end result of the trends in income and the distribution of the adult population is that nearly half of aggregate income today is in the hands of households where only one-in-five adults lives. Much of this redistribution of income occurred in the 1980s and the 1990s. In those two decades, the growth in income for upper-income households greatly outdistanced the growth in income for middle-income households.