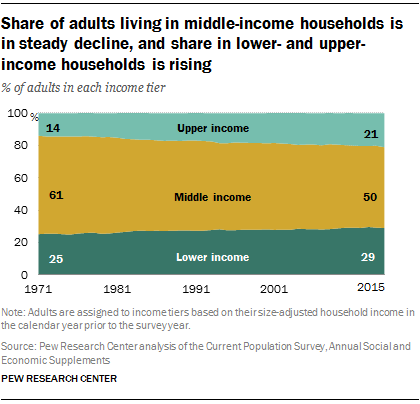
The share of the American adult population that is middle income is falling, and rising shares are living in economic tiers above and below the middle. The hollowing of the middle has proceeded steadily for four decades, and it may have reached a tipping point. Once in the clear majority, adults in middle-income households (based on the definition of “middle income” used in this report) in 2015 were matched in number by those in lower- and upper-income households combined.
The analysis also finds that the movement out of the middle has not simply been at the margins – the growth has been at the extreme ends of the income ladder. The shares of adults living in lower-middle income or upper-middle income brackets are relatively unchanged since 1971. Meanwhile, the fastest-growing numbers are in the very lowest and very highest income tiers.
The diminishing size of the middle is not all bad news, however. The share of U.S. adults living in both upper- and lower-income households rose from 1971 to 2015, but the share in the upper-income tier grew more. On balance, there is more economic progress than regression.
These findings emerge from Pew Research Center’s analysis of data from the Census Bureau’s Current Population Survey for 1971 to 2015. The specific data analyzed are from the Annual Social and Economic Supplement, conducted in March of each year, in which respondents provide household income data for the previous calendar year.16 For this reason, adults who were surveyed in a given year are classified as lower, middle or upper income based on their household income in the previous year. In this report, income data refer to the 1970-2014 period and the demographic data from the same survey refer to the 1971-2015 period.
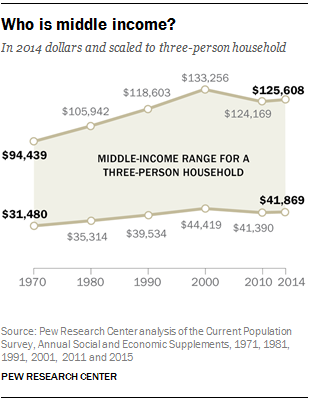
What it takes to be middle income has changed over time

Middle-income households are defined as those with an income that is 67% to 200% (two-thirds to double) of the overall median household income, after incomes have been adjusted for household size. Lower-income households have incomes less than 67% of the median, and upper-income households have incomes that are more than double the median.17
Because overall median household income in the U.S. has changed over time, the minimum amount it takes to be middle income has also changed. As shown in more detail in section 4, household incomes overall increased from 1970 to 2000 and then fell thereafter. The setbacks since 2000 may be traced to two recessions – the 2001 recession and the Great Recession of 2007-09 – and the slow economic recoveries after each.
As the median income overall increased in the years prior to 2000, the threshold for attaining middle-income status increased, from about $31,000 in 1970 to about $44,000 in 2000, for three-person households. With the economic reversals in the 21st century, the threshold fell to $41,000 in 2010. The economic stability more recently has pushed the threshold closer to $42,000 in 2014.
The top end of the middle-income range has changed similarly over time. In 1970, middle-income households could have an income as high as $94,000. This limit rose to $133,000 by 2000, but then decreased to $126,000 by 2014.
How many adults are middle income?

As the share of middle-income adults has decreased, the shares at the high and low ends of the income distribution have grown. The share of the adult population in the upper-income tier rose from 14% in 1971 to 21% in 2015. The share in the lower-income tier also increased, from 25% in 1971 to 29% in 2015.
Thus, from 1971 to 2015, the distribution of adults by income has hollowed in the middle, with greater shares living at the top and the bottom. The 7 percentage point gain at the top is nearly double the 4 percentage point growth at the bottom.
In terms of numbers, American adults who lived in middle-income households in 2015 were matched by those who did not. Of the total adult population of 242.1 million in 2015, 120.8 million were middle income and 121.3 million were either low income or upper income. By contrast, in 1971, the 80 million middle-income adults greatly outnumbered the other 51.6 million adults.18

As the middle-income population hovers near minority status, the population of upper-income adults is growing more rapidly than the population of lower-income adults. From 1971 to 2015, the number of adults in upper-income households increased from 18.4 million to 51 million, a gain of 177%. During the same period, the number of adults in lower-income households increased from 33.2 million to 70.3 million, a gain of 112%.
A closer look at the rise of lower- and upper-income populations
A more detailed analysis of the income distribution of adults reveals that a deeper polarization is underway in the American economy. The movement out of the middle-income tier has been more than just a step in one direction or the other. The fastest-growing segments are the ones at the extremes, the very lowest and highest ends of the income distribution.
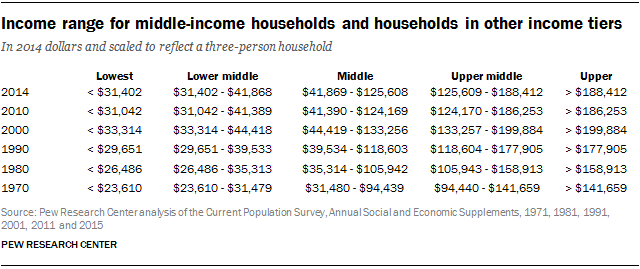
This finding emerges from a division of the lower- and upper-income tiers into two groups each. The lower-income group is divided into lowest-income households (with income less than half the overall median) and lower-middle income households (with incomes from half to less than two-thirds of the overall median). In 2014, a lowest-income household lived on about $31,000 or less, and a lower-middle income household lived on about $31,000 to $42,000.19
In a similar fashion, upper-income households are divided into upper-middle income households (whose income is more than two and up to three times the overall median income) and highest-income households (with more than three times the overall median income). In 2014, an upper-middle income household lived on about $126,000 to $188,000, and a highest-income household lived on more than $188,000.
The division of the adult population into five income tiers shows that the number of lowest-income adults grew more sharply than the number of lower-middle income adults from 1971 to 2015. Among upper-income adults, the number in the highest-income tier grew more than the number in the upper-middle tier over the same period.


In 2015, 20% of U.S. adults lived in the lowest-income households, compared with 16% in 1970. Just 9% of the adult population lived in lower-middle income households in 2015 and 1971. Thus, the growth in the nation’s lower-income tier was concentrated at the very bottom.
Mirroring the change at the low end of the distribution, the growth of the upper-income adult population skews to the very top. The share of adults in highest-income households more than doubled, from 4% in 1971 to 9% in 2015. Meanwhile, the increase in the share of adults in upper-middle income households was more modest, from 10% in 1971 to 12% in 2015.
Thus, the distribution of adults by income is thinning in the middle and bulking up at the edges. The number of adults in highest-income households quadrupled from 5 million in 1971 to 20.9 million in 2015, and the number in upper-middle income households more than doubled, from 13.4 million in 1971 to 30.2 million in 2015. The number of adults in lowest-income households also rose sharply, from 21.6 million in 1971 to 48.9 million in 2015. The growth in numbers in between – in lower-middle and middle-income households – was more modest. The adult population in lower-middle income households increased from 11.6 million in 1971 to 21.4 million in 2015, and the number of adults in middle-income households increased from 80 million to 120.8 million over the period.


