The analysis is based on the monthly Current Population Survey (CPS). Collected by the Census Bureau, the CPS is the basis for the national unemployment rate estimate released each month. Designed to be a labor force survey, the questionnaire also collects detailed demographic information on about 130,000 respondents each month.
The particular CPS data files utilized are the annual merged outgoing rotation group or MORG files. Rather than interviewing a completely new sample of respondents each month, the Census Bureau reinterviews some households from previous months. The rotation pattern of the households results in about one-quarter of the households each month not being interviewed again in that same calendar year. These “outgoing” households form the outgoing rotation group. The yearly MORG file simply sandwiches each month’s outgoing rotation group together into one file to form the merged outgoing rotation group file.
A virtue of the MORG file is that it has a large sample of households. Each outgoing rotation group is a quarter of the monthly sample, so that twelve months combined together results in a sample three times that of a regular monthly sample. The MORG file excludes respondents under age 16, so a file will have around 320,000 respondents ages 16 and older. All the data are appropriately weighted so that it is nationally representative of the civilian non-institutionalized population ages 16 and older.
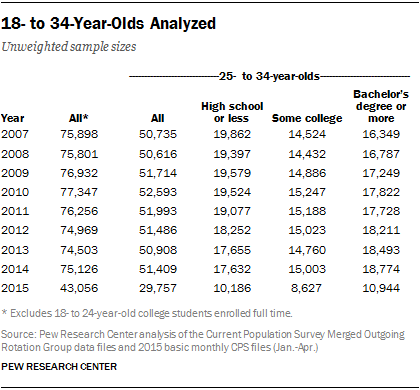
The unweighted sample sizes for the particular populations analyzed are shown in the table to the right.
Admittedly, the 2015 data are not directly comparable to the earlier years. 2015 is not finished, so the 2015 data are not a complete MORG file. But the first four months of 2015 CPS data are publicly available, and, in order to be as up-to-date as possible, we include this information. What is labelled 2015 is the first third of 2015, or the January through April 2015 basic monthly data. Specifically, the 2015 file is the entire April 2015 basic monthly CPS data plus the outgoing rotation groups from the January to March 2015 CPS data.
By using the January to March outgoing rotation groups, the 2015 file does not have any duplicates; that is, each person is interviewed only once.
By using the entire April monthly data (and not just April’s outgoing rotation group) the sample size increases. But the first four months are not equally weighted. April’s behavior gets greater representation.
No attempt was made at seasonal adjustment. That is, for years before 2015, the figures represent the annual average. 2015’s figures represent the first third of the year with an overemphasis on April’s results.
Finally, in the Current Population Survey, unmarried college students residing in dormitories are treated in a noteworthy manner. These students are assigned as living in the home of their parent(s), rather than being classified as living in dormitories. As a result, the CPS will overestimate the proportion of young adults literally living in their parents’ homes and not living independently. Recognizing this idiosyncracy of the survey, the analysis excluded 18- to 24-year-olds enrolled in college full-time (the population most likely to be unmarried college students residing in dorms). This is not a perfect solution because some 18- to 24-year-old full-time college students do indeed live with their parents and not in dormitories. But we veered toward slightly underestimating the share of young adults living with their parents rather than overestimating it.
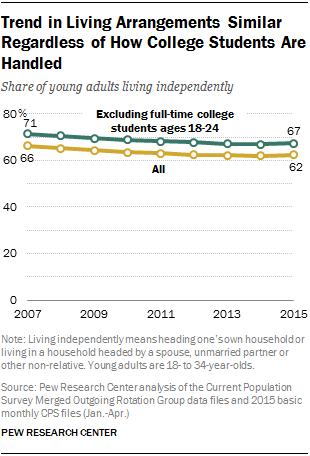
In 2015, if all 18- to 34-year-olds are analyzed, then 62% live independently. This estimate does not treat unmarried college students residing in dorms as living independently. Alternatively, if 18- to 24-year-old full-time college students are excluded, then 67% of young adults are estimated to live independently.
Most importantly for our purposes, the time trend in the data showing a decline in young adults living independently is virtually identical whether 18- to 24-year-old full-time college students are included or not.