
Second-generation Latinos and Asian Americans are significantly more likely than the first generation to say their group gets along well with people from other racial and ethnic groups, according to an analysis of recent Pew Research Center surveys conducted with a nationally representative sample of Hispanics and a separate nationally representative survey of Asian Americans.
The second generation is also more likely than the first generation to have a circle of friends that extends well beyond people from their country of origin.
The two surveys also find that second-generation Latinos and Asian Americans are more likely than the immigrant generation to say they would be “very comfortable” if their child married someone of a different country of origin or a different race or ethnicity.
Data collected by the U.S. Census Bureau on marriage trends offer partial confirmation that these expressions of acceptance reflect a larger reality. Second-generation Hispanics are roughly four times as likely as the first generation to be married to someone who is not Latino, while second-generation Asian Americans are about twice as likely as the first generation to marry a non-Asian, according to the 2010-2012 Current Population Survey.
Group Relations
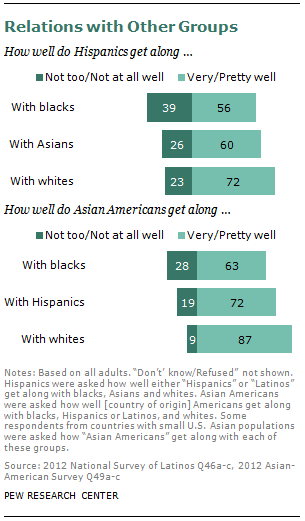
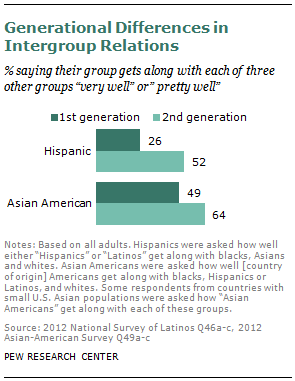
The survey asked respondents to rate how well their racial or ethnic group, as a whole, gets along with other racial and ethnic groups in the U.S.: whites, blacks, and either Hispanics or Asian Americans.
Overall, Asian Americans see group relations with these others in more positive terms than do Hispanics. The second generation, more so than the first generation, of both groups tends to see intergroup relations in a positive light. More second- than first-generation Latinos and Asian Americans say their group gets along with people from all three other racial and ethnic groups either “very well” or “pretty well.” Among Latinos, 52% of the second generation and 26% of the first generation see their group as getting along very well or pretty well with whites, blacks and Asian Americans. Among Asian Americans, the same pattern occurs; 64% of second-generation Asians and 49% of Asian immigrants say their group gets along with people from all three other racial and ethnic groups (whites, blacks and Hispanics) either very well or pretty well.
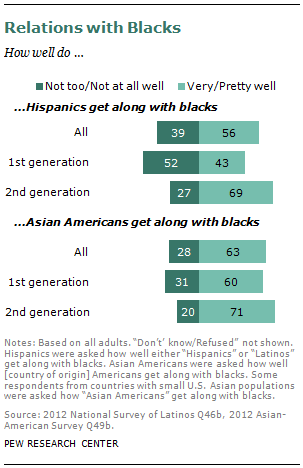
Group Relations with Blacks: Generational differences occur when Hispanics and Asian Americans are asked in the two surveys how well their group gets along with blacks.
About half (52%) of first-generation Latinos say Hispanics get along “not too well” or “not well at all” with African Americans. Yet among second-generation Hispanics, the proportion who report tensions between Latinos and blacks is only about half as large (27%). In place of perceived conflict, good relations prevail: Seven-in-ten (69%) second-generation adults report that Latinos get along very well or pretty well with African Americans.
Similar though less pronounced differences in attitudes exist between first and second generations of Asian Americans. About six-in-ten Asian immigrants say that Asian Americans from their home country get along very well or pretty well with African Americans.28 Among the second generation, that proportion is 11 percentage points higher (71%).
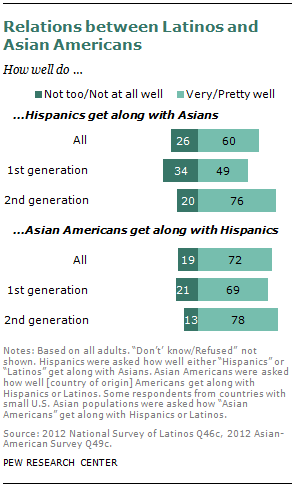
Latino-Asian Relations: Equally large generational differences occur in perceptions of how well Latinos and Asian Americans say they get along with each other.
About half (49%) of first-generation Hispanics report good relations with Asians, while 34% say the two groups do not get along. (An additional 17% did not rate group relations with Asians.) But among second-generation Latinos, about three-in-four (76%) say the groups get along very well or pretty well, and 20% report that they do not.
Similar though less pronounced differences surface among first- and second-generation Asian Americans. Among the second generation, about eight-in-ten (78%) report good relations between Latinos and Asian Americans from their country of origin, nine percentage points more than the share among the immigrant generation (69%).29
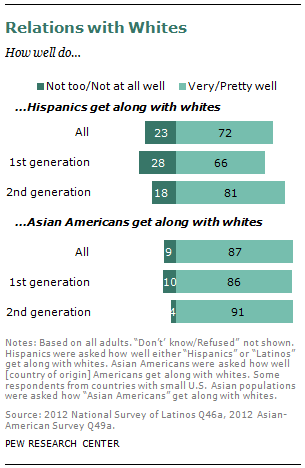
Group Relations with Whites: Hispanics and Asian Americans tend to see group relations with whites in more positive terms than with either blacks or with each other. But here, too, generational differences emerge.
Two-thirds of Latino immigrants say their group gets along with whites either very or pretty well. That figure is higher among second-generation Latinos, of whom 81% say their group gets along well with whites.
Less dramatic generational differences occur among Asian Americans. Fully 86% of Asian immigrants say their group gets along with whites very well (25%) or pretty well (61%). More second-generation Asian Americans say their group gets along with whites (91%); 31% say the two groups get along very well and 61% pretty well.30
Friendships
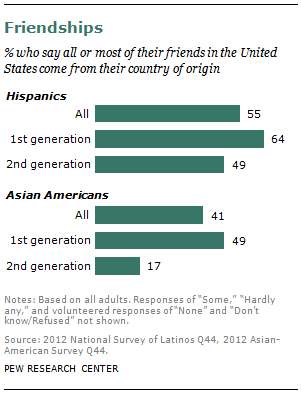
Hispanics and Asian Americans who were born outside the United States are significantly more likely than the second generation to say most or all of their friends are also from their home country.
Among Hispanics, about two-thirds of the foreign born (64%) say all or most of their friends in the United States also trace their roots to the same country of origin, compared with 49% of second-generation Latinos.
The “friendship gap” is even larger among Asian Americans. Among the first generation, about half (49%) say their friends are mostly from their country of origin. In contrast, only 17% of the second generation has as narrow a circle of friends.
Generations and Attitudes toward Intermarriage
Large generational differences also emerge on questions measuring attitudes toward intermarriage.
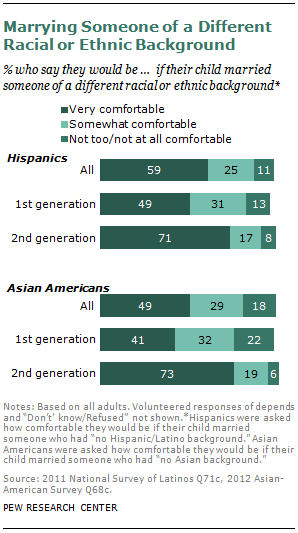
About half (49%) of first-generation Hispanics but 71% of the second generation say they would be “very comfortable” if their child married someone who was not Hispanic.
Among Asian Americans, about four-in-ten (41%) of the first generation but 73% of the second say they would be “very comfortable” if their child married someone who is not Asian.
A similar pattern emerges when respondents are asked in a separate question how comfortable they would be if their child married someone who was not from their country of origin.
About six-in-ten (58%) first-generation Hispanics but 76% of the second generation say they would be very comfortable if their child married someone from a home country different from their own. Similarly, close to half (46%) of foreign-born Asian Americans and 78% of the second generation would be very comfortable to welcome a son- or daughter-in-law who was not from their country of origin.
Intermarriage Rates
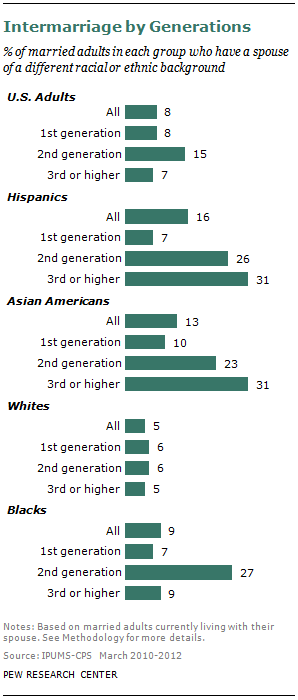
Data from the 2010 through 2012 Current Population Surveys show that these contrasting views on intermarriage echo generational differences in marriage patterns.
Overall about 8 percent of all married adults in the U.S. have a spouse of a different race or ethnicity; intermarriage is more common among second-generation immigrants (15%) than those in the first generation (8%).31 This generational pattern holds among most race and ethnic groups, except among whites.
About a quarter of married second-generation Hispanics (26%) have intermarried, compared with 7% for members of the first generation. The proportion where the spouse is non-Hispanic increases to 31% among Latinos in the third generation and higher.
Among those who are married, about a quarter (23%) of second-generation Asian Americans have a non-Asian spouse, compared with 10% of the immigrant generation. The percentage with a non-Asian spouse rises to 31% among Asian Americans in the third generation and higher.
In contrast, intermarriage for non-Hispanic whites is about the same across generations. Among this group, only 6% of the first generation have a spouse of a different race or ethnicity, identical to the percentage for second-generation whites and about equal to the 5% for later generations.
Among those who are married, 9% of blacks are married to someone who is not black. About 7% of all married black immigrants have a spouse who is not black. That proportion rises to 27% of the second generation. Unlike Hispanics and Asian Americans, similar percentages of blacks in the first generation and the third generation or higher intermarry (7% and 9%, respectively). The different pattern of intermarriage across generations of blacks could be related to a number of factors. Although the U.S. has a sizable black population as a legacy of slavery, voluntary black immigration is a relatively recent trend. There was almost no significant black immigration from about 1850 through 1970; the percentage of immigrants in the black population was never higher than 1.5% during that period. As such, second-generation blacks descending from the immigrant generation also have a more recent history in the U.S. Differences between the native stock (third generation or higher) and the immigrant stock (first and second generations combined) in the black population are not likely driven by trends in immigration over the past 150 years.
Recent Marriages: While this analysis is based on U.S. adults who are married—whether those vows were taken in the past few years or past few decades—the same generational differences are found for married adults ages 18 to 29 as among all adults. The patterns among younger adults reflect relatively recent marriage trends, while the patterns in the entire adult population are a function of longer-term trends in marriage patterns. Thus, while intermarriage has become more common in the population as a whole in recent years, the generational difference in intermarriage is also present among younger, more recently married adults.32
Immigrants and Marriage before Arrival: Some of the generational differences in marrying outside of one’s racial or ethnic group may be explained by the fact that many immigrants are already married when they arrive in the United States. A previous Pew Research Center analysis of new marriages finds the intermarriage rate is higher among U.S.-born (i.e., second generation and higher) Hispanics and Asian Americans than among the first generation of each group, a pattern that has held since 1980 even for immigrants who married after coming to the U.S.33
Group Size and Intermarriage: It is important to keep in mind that the percentage married to someone of another race or ethnic group is influenced by the size of each group in the population. A smaller race or ethnic group has, by definition, a smaller pool of potential spouses from the same race or ethnic group and a larger pool of potential spouses from a different group. In the U.S., for example, it is mathematically impossible for intermarriage rates of the majority race or ethnic group, non-Hispanic whites, to surpass those of smaller race and ethnic groups even if intermarriage rates for those smaller groups were 100%.
Patterns of Intermarriage by Gender and Education
Intermarriage also tends to vary by gender and education. However, the overall generational pattern found among Hispanics, Asian Americans, and blacks—with more in the second generation than in the first marrying outside their group—tends to hold for both men and women and across education levels.
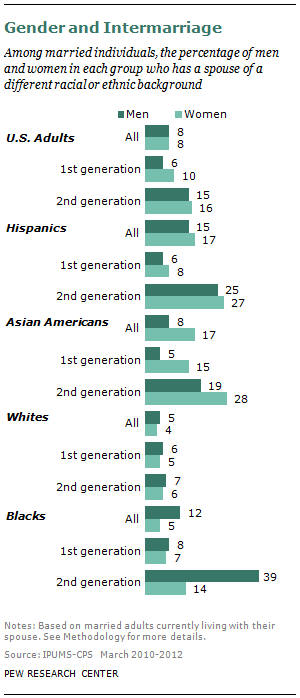
Gender: Overall, there are no gender differences in the prevalence of intermarriage for married men and women by generation.
There is a modest gender difference in intermarriage among first-generation Hispanics (6% for men and 8% for women). Married Hispanic men and women in the second generation are about equally likely to have a spouse who is not Latino.
While Asian-American women are more likely than men to intermarry, generational differences in intermarriage hold among both men and women.
Among whites, men and women within the first and second generation are about equally likely to intermarry.
Overall, black men are more likely than black women to intermarry (12% versus 5%). This gender difference is especially pronounced among second-generation blacks; immigrant black men and women are about equally likely to be intermarried.
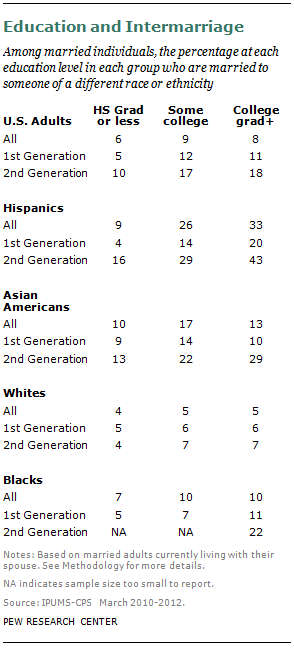
Education: Overall, there is a modest relationship between educational attainment and intermarriage among all those currently married.34 The strength of the association between education and intermarriage varies somewhat across racial and ethnic groups; it is strongest among Hispanics.
Generational differences in intermarriage tend to hold across education differences, with the second generation more likely than the first generation to intermarry, regardless of education level.
Among married Hispanics, those who attended college are significantly more likely than those who did not to have a non-Hispanic spouse. This association is especially strong among second-generation Hispanics but also occurs among the first generation.
A somewhat different pattern emerges among married Asian Americans. Among the second generation, about three-in-ten college graduates (29%) have a spouse who is a non-Asian, while 13% of those with a high school diploma or less schooling have a non-Asian spouse. But among members of the first generation, the intermarriage rate is virtually identical for those with college degrees (10%) and those with a high school diploma or less schooling (9%).
There is no relationship between education and intermarriage among first-generation whites, although there is a modest relationship among second-generation whites. And there are too few second-generation blacks for a full analysis of intermarriage by generation and education; among first-generation blacks, higher education is associated with more intermarriage.


