
Section 2: Who Owes the Outstanding Student Debt?
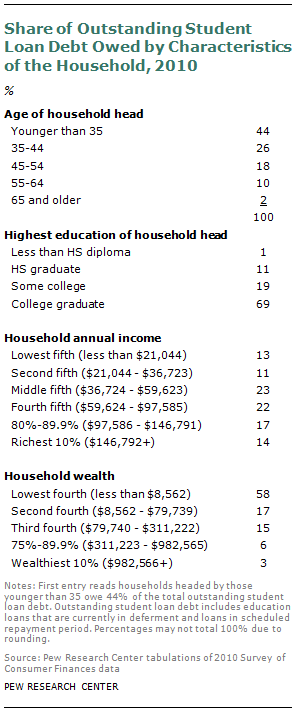
Most of the nation’s outstanding student loan debt is owed by younger households. In 2010, 70% of the total student debt was owed by households headed by those under age 45. Nearly a fifth (18%) of the outstanding debt was owed by households age 45-54.5
The outstanding debt is overwhelmingly owed by relatively well-educated households. In 2010 nearly 90% of the debt was owed by households whose head had completed at least some college education and almost 70% was owed by households whose head had finished college. These households are “relatively well-educated” since only 56% of the nation’s households in 2010 were headed by those who had at least completed some college education.
Since the nation’s outstanding student debt is largely owed by the nation’s younger households as well as better-educated households, it is not clear which households would be expected to owe student debt in terms of economic affluence.
By the yardstick of current household annual income, the 2010 outstanding student debt was disproportionately owed by the nation’s middle- and upper-income households. The poorest two-fifths, or 40% of households (households with an annual income of $36,723 or less), owe only 24% of the 2010 outstanding student debt. The next richest 40% of households (those with an annual income between $36,724 and $97,585) owe 45% of the outstanding student debt. The richest fifth of households (those with an income of $97,586 or more) owed 31% of the student debt.6
In terms of household wealth or net worth, the nation’s least wealthy households owe most of the student debt. In 2010 the least wealthy fourth of households (those whose net worth is less than $8,562) owed 58% of the outstanding student debt.
That the least wealthy owe most of the student debt reflects at least two factors: The student debt is largely owed by younger households, and for most households it takes many years to accumulate their nest eggs.
It also reflects the manner in which net worth is measured. Conventionally measured net worth equals the value of the household’s assets minus liabilities. Outstanding student debt is included among the household’s liabilities. But the household assets include only financial assets, properties, equity in businesses and other tangible assets (for example, jewelry and collectibles). Net worth does not include the value of human capital. Conventionally measured net worth is biased to show that student debtors have less wealth because the debt is counted but the corresponding asset (i.e., human capital) is not included as an asset.7
Who Owes the Mounting Student Debt?
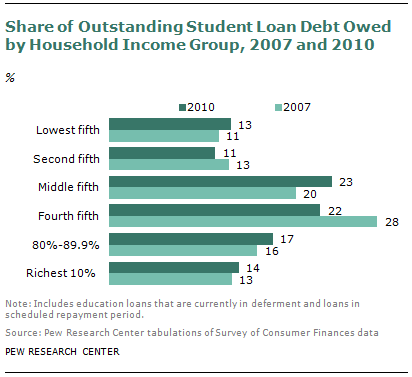
In terms of household income, the nation’s least well-off and most well-off households owe more of the outstanding student debt than in 2007. In 2007 the poorest one-fifth of households owed 11% of the debt outstanding.8 By 2010 they owed 13% of a significantly larger aggregate student debt. At the other end of the income spectrum, the richest one-fifth also owed a greater proportion of student debt. In 2007 the richest one-fifth of households owed 28% of the outstanding debt; by 2010 this income category owed 31% of the outstanding debt. Between 2007 and 2010, the middle three-fifths of households by income owed a shrinking share of a growing student debt pie.


