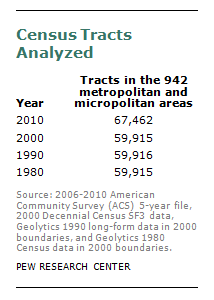
Tract-level data on household income are available in the SF3 files of the decennial census and the 2006 to 2010 American Community Survey (ACS) five-year file. For 1990 and 1980, the Geolytics data products that normalize the long-form data into 2000 geographical boundaries were utilized.

In the 2010 ACS five-year data (available on the Census Bureau’s American Fact Finder), there are 73,057 census tracts in the 50 states and District of Columbia. For 2010 this analysis examined the 67,462 census tracts in metropolitan and micropolitan areas. For 1980 to 2000 the analysis does not examine the same 67,462 census tracts. As the population grows over time, the Census Bureau delineates more census tracts so the number of census tracts grows across censuses. However, the 942 metropolitan and micropolitan areas are composed of counties. Counties change very little across censuses. For the earlier years, the tracts in the same counties that were analyzed in 2010 are included in the analysis. So though we are not analyzing a constant number of census tracts, we are analyzing uniformly the tracts in the counties that comprise the 2010 metropolitan and micropolitan areas.
The methodology used is very similar to the widely noted study by Massey and Fischer (2003). They examined neighborhood change in 60 metropolitan areas, including the 50 largest in population.
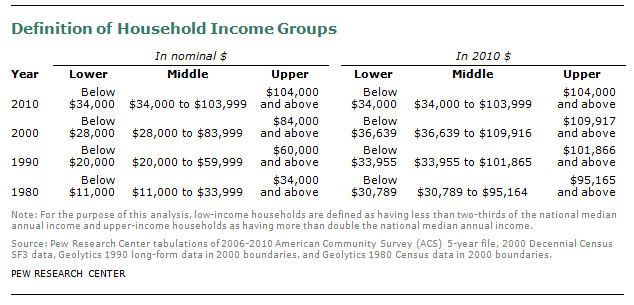
In each year, “lower income” refers to households with a household income less than 67% of the national median household income. “Middle-income” households have a household income between 67% and 200% of the national median household income. “Upper-income” households have incomes more than twice (200%) the national median household income. These income thresholds were used in this report by the Pew Research Center because they result in a class distribution that roughly comports with the way that Americans self-identify as members of different socio-economic classes. (However, we also ran our analyses with other thresholds and found the same patterns and trends, regardless of which cut points we used).
For the national analysis, the following household income cut points define lower-, middle- and upper-income households:

Note that the Census Bureau tract-level household income data are available only in bracketed form—meaning that counts of households are shown within income ranges. For some parts of the income distribution the brackets can be fairly wide. For example, census data show that the total number of households with an income between $150,000 and $199,999 are located in a given census tract—but no finer detail than that.
To conduct a more precise analysis that allowed for estimates to be made on the basis of household income to the nearest $1,000 interval, the Pew Research Center applied a statistical technique known as osculatory interpolation. Our interpolation of the income data was achieved by applying a well-established formula known as the Sprague method. This formula reproduces the original data, meaning that the sum of the interpolated data always adds up to the published group data. See Siegel and Swanson (2008) for an explanation of the Sprague method.


