
U.S. stock markets have been on a roll since late October, with shares trading at or near record highs. But the booming markets are likely to benefit White families more than families from other racial and ethnic groups.
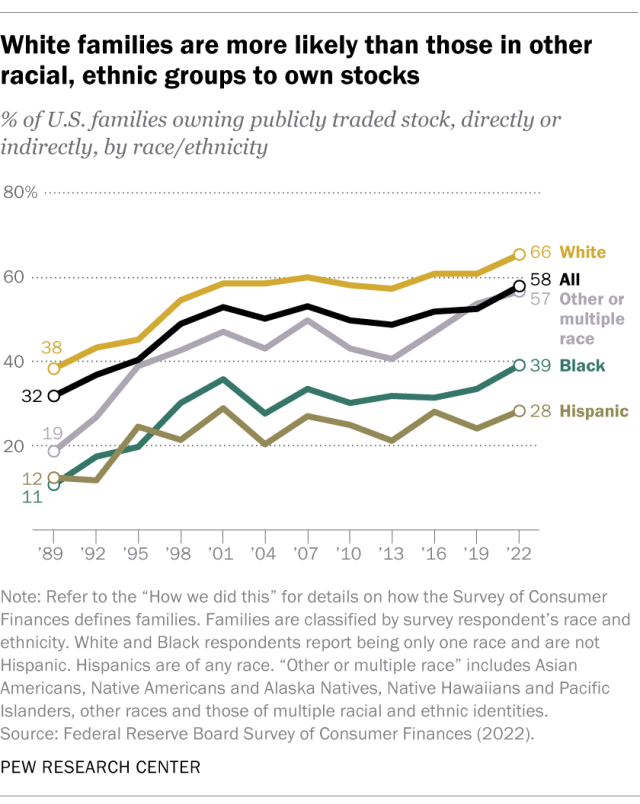
That’s because White families are the most likely to own publicly traded stocks, either directly or indirectly – for example, through a retirement account or mutual fund. In 2022, nearly two-thirds of White families (66%) owned stocks directly or indirectly, compared with 39% of Black families and 28% of Hispanic families, according to the Federal Reserve’s Survey of Consumer Finances (SCF).
And even when families of other racial and ethnic backgrounds own stock, they own a lot less than White families do. The median value of total stock holdings among White families in 2022 was $67,800, compared with $24,500 for Hispanic families and $16,500 for Black families. (The SCF includes limited data for Asian American families, discussed below, but not data on their stock holdings or ownership of other specific assets.)
Similarly, the mean (or average) value of total stock holdings was $568,100 among White families, $97,400 for Hispanic families and $80,400 for Black families. The means are considerably higher than the medians because stock ownership is highly skewed. Most families own relatively little, but a few very wealthy families own quite a lot.
Pew Research Center conducted this analysis to explore U.S. stock ownership among families of different races and ethnicities. Our primary data source is the Survey of Consumer Finances (SCF), which is sponsored by the Federal Reserve Board and the Treasury Department. The SCF, a cross-sectional survey of U.S. families, has been conducted in its modern form every three years since 1989. It yields data on families’ income, assets, debts and other liabilities, pensions and net worth, along with their demographic characteristics.
The SCF defines a “family” as an “economically dominant” single person or couple, along with everyone else in the household who is “financially interdependent” with that person or couple. A family’s race or ethnicity is determined by the race or ethnicity of the survey respondent – the family’s economically dominant single person, the male in an opposite-sex couple or the older person in a same-sex couple.
The SCF’s asset ownership data is broken down into four racial and ethnic groups: non-Hispanic White, non-Hispanic Black, Hispanic/Latino, and other or multiple race. The latter group includes, among others, Asian Americans, Native Americans and Alaska Natives, Native Hawaiians and Pacific Islanders, and people who report more than one racial identification.
In 2022, the SCF was adjusted to oversample households that were predicted to be non-Hispanic Black, Hispanic, or Asian American. This allowed the survey, for the first time, to report income and net worth figures specifically for Asian families, who comprised nearly 4% of families in that year’s survey. However, the 2022 report does not detail Asian families’ ownership of specific assets, such as stocks.
Along with its regular geographically based random sample of U.S. families, the SCF includes a supplemental sample that is intended to disproportionately include wealthy families. This is because such families own a relatively large share of certain thinly held assets, such as noncorporate businesses and tax-exempt bonds. In 2022, 3,298 of the SCF’s respondents were from the random sample and 1,304 were from the supplemental sample.
Dollar amounts from the SCF are expressed in 2022 dollars. The Fed researchers converted previous years’ figures into 2022 dollars using the “current methods” version of the Consumer Price Index for All Urban Consumers (CPI-U-RS). All dollar figures are rounded to the nearest $100.
This analysis also includes data from a 2023 Center report and a 2024 study by the Federal Reserve Bank of New York. More information about these sources can be found at the links in the text.
Stock ownership over time, by race and ethnicity
These patterns have been broadly apparent since 1989, the first year the SCF was conducted in its current form. Still, more Black families have exposure to the stock market than ever before. The share of Black families owning stock directly or indirectly had previously peaked at 36% in 2001, in the midst of the dot-com collapse that tanked many first-wave internet companies.
But consider: In 1989, just 11% of Black families owned stocks, compared with 38% of White families. In other words, almost the same share of White families owned stocks then as Black families do now.
Meanwhile, the share of Hispanic families owning stocks has fluctuated between 20% and 30% since 1995, peaking at 29% in 2001.
Overall, 58% of U.S. families had some sort of exposure to the stock market in 2022, the highest level ever recorded by the SCF. The median value of those holdings was $52,000; the mean value was $489,500.
Many ways to own stock
There are, of course, many ways to participate in the stock market. Only 21% of American families own shares directly, according to the SCF. Even fewer own “pooled investment funds” – such as mutual funds and exchange-traded funds (ETFs) – or other investment vehicles that typically include stocks among their holdings.
By far the most common way to own stock is through a retirement plan, such as an employer-sponsored 401(k) or 403(b) program or an individual retirement account (IRA). A record 54% of American families had such a retirement plan in 2022. (Note that these sorts of accounts can include assets other than stocks.)
Again, however, there are wide gaps between racial and ethnic groups when it comes to retirement accounts. While more than six-in-ten White families (62%) have at least one such account, only 35% of Black families and 28% of Hispanic families do.
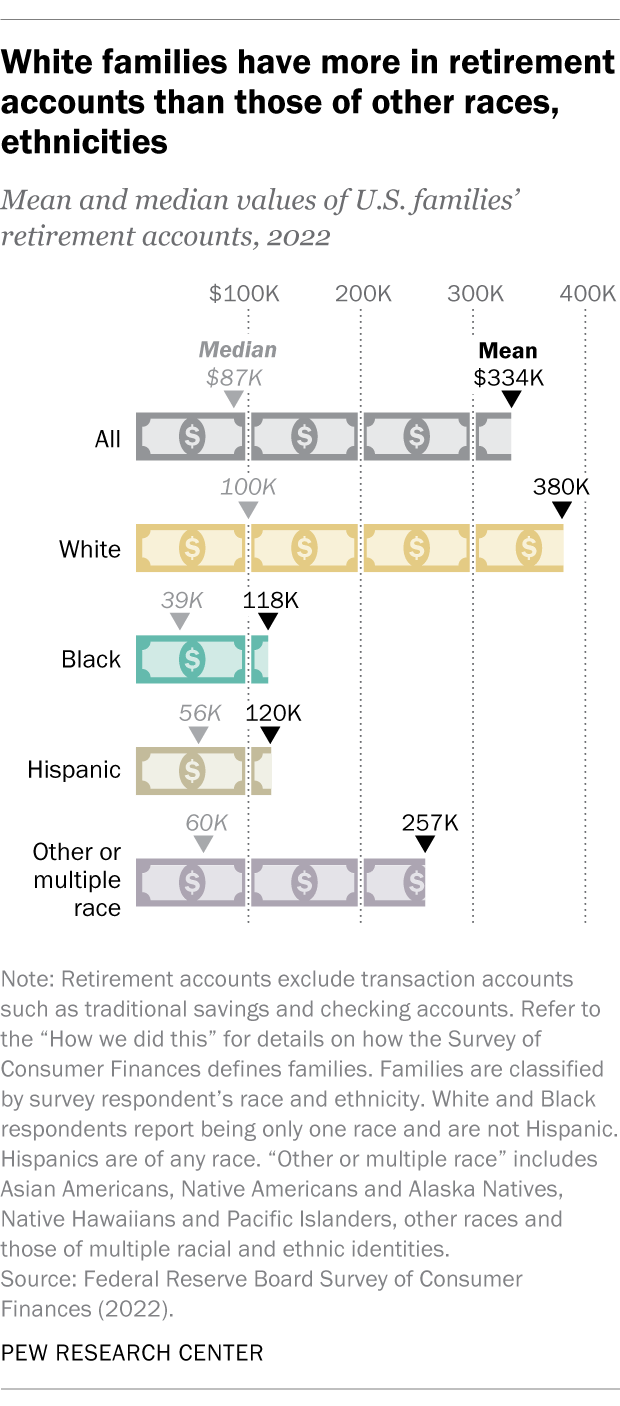
And the retirement accounts of families who aren’t White tend to be a lot smaller. The median value of retirement accounts held by Black families in 2022 was $39,000, compared with $55,600 for Hispanic families and $100,000 for White families. The disparity in mean values was even wider: $117,500 for Black families and $120,300 for Hispanic families but $380,300 for White families.
A 2023 Pew Research Center analysis found similar gaps in asset ownership at the household level using a different data source, the U.S. Census Bureau’s Survey of Income and Program Participation. That analysis found that 47% of Asian households and 35% of White households owned bonds, stocks and mutual funds in 2021, compared with 18% of Black households and 16% of Hispanic households.
Not only are White families and households more likely to own stocks, but stocks also make up a greater share of White individuals’ overall wealth.
A recent study from the Federal Reserve Bank of New York found that 35% of White Americans’ individual financial wealth is invested in stocks and mutual funds, versus 8% and 14% for Black and Hispanic Americans’ financial wealth, respectively. The New York Fed researchers noted that people with more of those kinds of investments tended to see their wealth grow faster between 2019 and 2023 than people with less of them because those types of assets increased in value especially rapidly over that period.
Comparing median net worth
Financial investments are only one factor contributing to a family’s overall net worth, which is calculated as total assets owned minus total debts. Asian American families as a whole have a higher median net worth than all other racial and ethnic groups, according to the SCF data. (Other research, however, has found that economic well-being varies widely among Asian origin groups.)
The median net worth of Asian American families in 2022 was $536,000, almost twice that of White families ($285,000) and far ahead of Hispanic families ($61,600), Black families ($44,900) and families of other or multiple races ($62,900).
