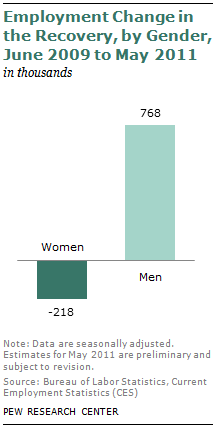
The recovery from the Great Recession is not off to a good start for women. From June 2009, when the recession ended, to May 2011, women have lost 218,000 jobs, with their employment level falling from 65.1 million to 64.9 million. Men, however, are finding new jobs in the recovery. Their employment level increased from 65.4 million in June 2009 to 66.1 million in May 2011, a gain of 768,000 jobs. Since 1970, this is the first two-year period into an economic recovery in which women have lost jobs even as men have gained them.
The contrasting trends for men and women in the recovery are reopening the gender gap in employment. At the start of the recession, in December 2007, men held 3.4 million more jobs than women. In the recession, job losses for men were more severe than for women and by the end, in June 2009, men held only 223,000 more jobs than women. This gap stretched out to 1.2 million in May 2011, two years into the economic recovery.
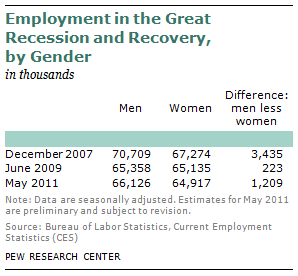
Although the latest trends in employment are working in favor of men, the full period of the recession and the recovery has set men back more than women. From December 2007 to May 2011, the employment of men has decreased from 70.7 million to 66.1 million, or by 4.6 million. For women, employment has fallen from 67.3 million to 64.9 million, or by 2.4 million. Thus, while men have taken an early lead in the recovery, they still have far more ground to cover than women to return to pre-recession employment levels.
Employment Trends in the Recovery by Industry
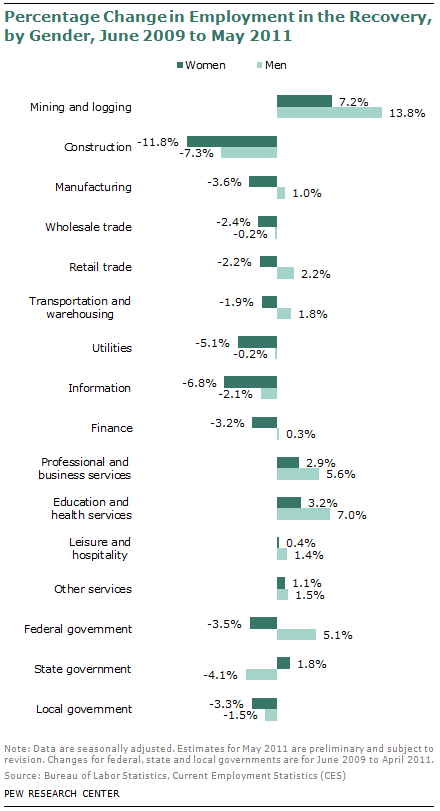
The relative strength of the economic recovery for men is widespread—they have fared better than women in all but one of 16 major sectors of the economy identified in this report. In five sectors, men gained jobs while women lost jobs. These sectors are manufacturing; retail trade; transportation and warehousing; finance; and the federal government. The most notable of these is retail trade, where men gained 159,000 jobs in the recovery and women lost 165,000 jobs. In the five sectors combined, men found 392,000 new jobs while women lost 497,000 jobs. This gap is at the heart of the difference in the employment recovery for men and women.
In five other sectors—mining and logging; education and health services; professional and business services; other services; and leisure and hospitality—both men and women gained jobs, but men did so at a faster rate. Most notably, men gained 804,000 jobs in professional and business services and education and health services. Women, for whom education and health services is a significant source of jobs, gained 691,000 jobs in those two sectors. These five industries combined employed 1 million more men and 754,000 more women.
In five sectors, both men and women lost jobs but the rate of job loss was more severe for women. These sectors are construction; wholesale trade; utilities; information; and local governments. For women, job losses in local government were also large in absolute terms—296,000. Men lost 380,000 jobs in construction alone. But their rate of job loss in construction—7.3% from June 2009 to May 2011—was less than the 11.8% decline experienced by women in construction. Collectively, these five sectors shed 505,000 jobs held by men and 519,000 jobs held by women.
In only one sector—state governments—have women gained jobs in the economic recovery and men have not. Overall, the government sector—federal, state and local combined—shed 297,000 jobs held by women and 133,000 jobs held by men.4 The private, nonfarm sector added 980,000 jobs in the economic recovery: 901,000 filled by men but only 79,000 filled by women. 5

Men and Women Are in Different Industries: How Has That Affected Their Jobs Recovery?
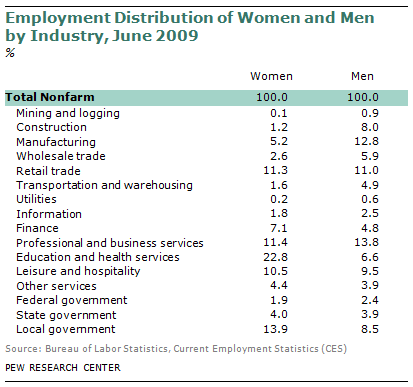
One reason that employment outcomes may differ during recessions and recoveries is that women and men are concentrated in different industries. For example, in June 2009, 22.8% of women were working in education and health services, compared with 6.6% of men. Meanwhile, only 6.4% of women were employed in construction and manufacturing, compared with 20.8% of men. Thus, growth in education and health services would favor women and growth in construction and manufacturing would favor men.
Is it the case that women are not doing as well as men in finding jobs in the recovery because the industries they lean to are underperforming? The short answer is, no. Education and health services—areas of strength for women—outperformed other sectors in adding jobs during the recovery. But construction and manufacturing—among the sectors men lean to most—remain mired in an economic slump.
To gain further insight into the issue, employment change for women can be simulated assuming that women are distributed across industries in the same fashion as men. That is, suppose that 6.6% of women were employed in education and health services in June 2009 instead of 22.8% as was actually the case; 20.8% were employed in construction and manufacturing instead of just 6.4%; and so on for the other industries. Given that hypothetical distribution, if women still experienced the same percentage change in employment in each industry as they actually did, the overall decrease in their employment would have been 1.2 million, not just 218,000.
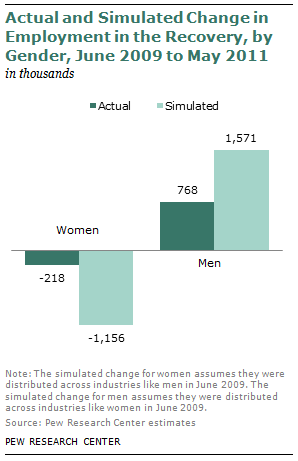
What if men had been distributed across industries like women? In other words, what if 22.8% of men, not 6.6%, were in education and health services, and so on in other industries? Under those circumstances, men would have gained 1.6 million jobs in the economic recovery, not just 768,000.
The simulations show that the gender gap in employment during the recovery may be deeper than revealed by published statistics. Women may have lost up to 1 million jobs more during the recovery if they did not have strong representation in growing industries such as education and health services. Conversely, men might have gained nearly 1 million more jobs if not for their greater reliance on the construction and manufacturing sectors.