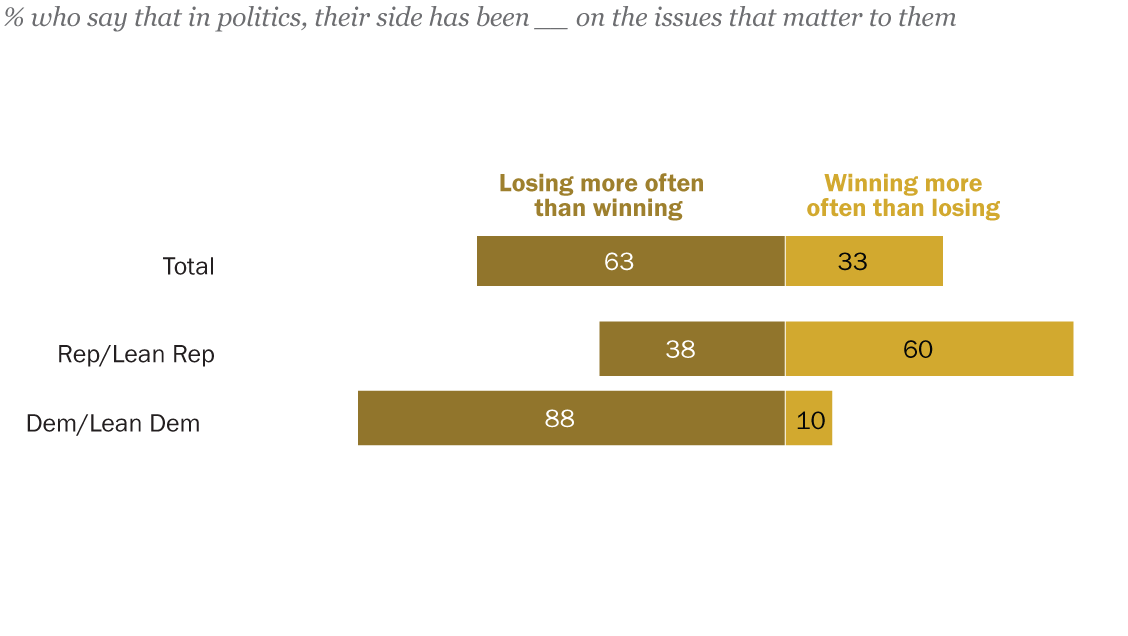
A year into President Donald Trump’s second term, and with his party controlling both chambers of Congress, six-in-ten Republicans say their side has been winning more often than losing on the issues that matter to them. Meanwhile, 88% of Democrats say their side has been losing, according to a Pew Research Center survey from January.
| party | Losing more often than winning | Winning more often than losing | |
|---|---|---|---|
| Total | total | 63% | 33% |
| Rep/Lean Rep | party | 38% | 60% |
| Dem/Lean Dem | party | 88% | 10% |
In the 10 years that we have asked this question, Americans overall have consistently been more likely to say their side is losing than to say it’s winning. That continues to be the case. Still, the share who say their side is winning (33%) is higher than at any point during the Biden administration.
This is largely because Republicans are now more likely to say their side is winning than Democrats were during Joe Biden’s presidency.
- Today, 60% of Republicans and Republican-leaning independents say their side is winning more often than losing. Majorities of Republicans also said this in 2020 (69%) and 2019 (54%), during the second half of Trump’s first term.
- By contrast, during Biden’s term, no more than 36% of Democrats and Democratic leaners said they felt like their side was winning more often than losing.
Over the last decade, partisans have been quite pessimistic when their party does not control the White House. But the 10% of Democrats who now say their side is winning is the lowest mark for either party since we first asked this question in spring 2016.
As a result, there is a partisan gap of 50 percentage points on this question – the widest we’ve seen.
| Date | Party | Winning more often than losing | Losing more often than winning |
|---|---|---|---|
| 5/2/16 | Total | 35% | 59% |
| 2/12/18 | Total | 29% | 67% |
| 5/13/19 | Total | 34% | 62% |
| 2/15/20 | Total | 41% | 56% |
| 9/19/21 | Total | 29% | 65% |
| 9/18/22 | Total | 24% | 72% |
| 1/22/24 | Total | 25% | 71% |
| 1/26/26 | Total | 33% | 63% |
| 5/2/16 | Rep/Lean Rep | 22% | 75% |
| 2/12/18 | Rep/Lean Rep | 44% | 53% |
| 5/13/19 | Rep/Lean Rep | 54% | 42% |
| 2/15/20 | Rep/Lean Rep | 69% | 29% |
| 9/19/21 | Rep/Lean Rep | 22% | 74% |
| 9/18/22 | Rep/Lean Rep | 17% | 81% |
| 1/22/24 | Rep/Lean Rep | 15% | 83% |
| 1/26/26 | Rep/Lean Rep | 60% | 38% |
| 5/2/16 | Dem/Lean Dem | 47% | 49% |
| 2/12/18 | Dem/Lean Dem | 20% | 78% |
| 5/13/19 | Dem/Lean Dem | 19% | 78% |
| 2/15/20 | Dem/Lean Dem | 18% | 80% |
| 9/19/21 | Dem/Lean Dem | 36% | 60% |
| 9/18/22 | Dem/Lean Dem | 31% | 66% |
| 1/22/24 | Dem/Lean Dem | 36% | 62% |
| 1/26/26 | Dem/Lean Dem | 10% | 88% |
Note: Here are the survey questions we used for this analysis, the detailed responses and the survey methodology.
