Medicaid, the joint federal-state health insurance program that covers about one-in-five Americans, may be in for some of the biggest changes in its 60-year history.
The tax, spending and policy bill making its way through Congress seeks to cut hundreds of billions of dollars from Medicaid over the next decade to help offset the measure’s even larger tax cuts. The Congressional Budget Office estimates that the Medicaid cuts, along with changes to other federal insurance programs, would lead to millions of people losing health coverage should the bill become law.
Given the changes that may be in store for the program and its overall complexity, here are answers to some common questions about Medicaid.
- What is Medicaid?
- Is Medicaid eligibility determined by the federal government or the states?
- Who’s eligible for Medicaid?
- How many people have Medicaid coverage?
- How has Medicaid enrollment changed over time?
- How do Medicaid enrollment rates vary around the country?
- What are the demographics of Medicaid enrollees?
- Are Medicaid enrollees required to work?
- How much does Medicaid cost?
- How much of federal and state budgets go to Medicaid?
- Where does all that money go?
- How big a role does Medicaid play in U.S. health care overall?
What is Medicaid?
Medicaid provides health insurance to various categories of low-income people. It’s funded jointly – though not equally – by the federal government and the states. However, the way the program is structured and run means that in many ways there’s no single Medicaid program. Rather, there are 56: one for each state, the District of Columbia and the five permanently inhabited U.S. territories.
Medicaid was created in 1965 at the same time as Medicare, the federal health insurance program primarily for people ages 65 and older. Both programs are overseen by the Centers for Medicare & Medicaid Services (CMS), an agency within the U.S. Department of Health and Human Services.
The Children’s Health Insurance Program (CHIP), created in 1997, is designed to cover children from families whose incomes are modest but too high to qualify for Medicaid. While CHIP is formally separate from Medicaid, the two programs are closely coordinated in practice. In fact, some states administer CHIP as an extension of their Medicaid programs, while others either operate CHIP separately or combine the two approaches. This analysis will present data for Medicaid and CHIP separately when possible.
Medicaid is broadly popular. More than eight-in-ten U.S. adults (83%) have a favorable opinion of the program, according to a recent survey by KFF, a nonpartisan research organization focused on health policy. That view is shared by 93% of Democrats, 74% of Republicans and 83% of independents.
Is Medicaid eligibility determined by the federal government or the states?
Both. The federal government sets general rules about who always qualifies for Medicaid and which health care services must be covered. Beyond that, states have considerable flexibility to determine the scope of their programs by extending eligibility to additional groups of people (or not) and covering various optional health care services (or not).
For example, under the federal Affordable Care Act of 2010, states can expand eligibility to adults with household incomes up to 138% of the federal poverty level – which in 2025 would be $44,367 for a family of four – with the federal government picking up 90% of the additional cost. Forty states and D.C. have expanded their Medicaid programs in this way, while the other 10 states have not.
Who’s eligible for Medicaid?
Originally, Medicaid was aimed at certain categories of low-income people: families with children, pregnant women, and the elderly, blind or disabled. People in those groups who received some form of public assistance generally also qualified for Medicaid coverage.
Those eligibility groups have broadened over time. States are required to cover some groups – for instance, children in foster care and former foster care youth up to age 26. Coverage is optional for others – for example, pregnant women and infants in households with incomes between 133% and 185% of the federal poverty level. Since each state sets its own eligibility criteria (within broad federal minimums), there’s no simple way to summarize them.
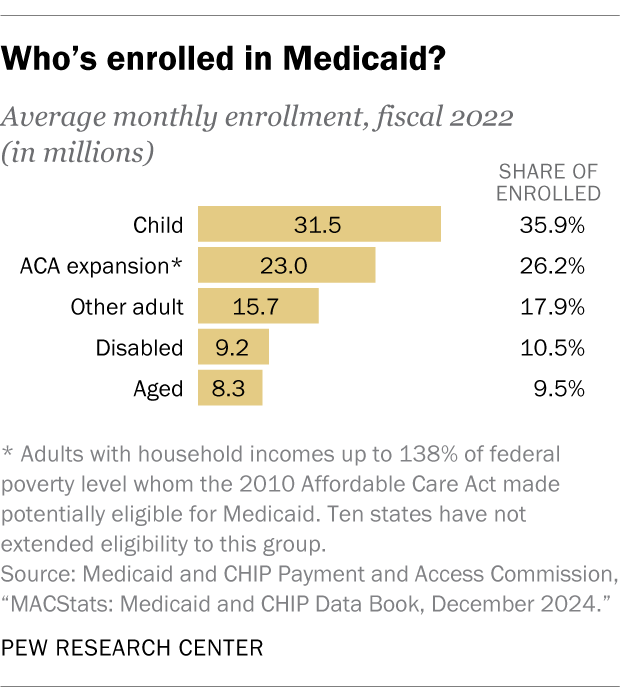
In fiscal year 2022, 36% of all Medicaid enrollees were children, according to the Medicaid and CHIP Payment and Access Commission. Another 26% were adults who had become eligible under the 2010 Affordable Care Act; 18% were adults who’d already been eligible; and 20% were elderly, blind or disabled.
How many people have Medicaid coverage?
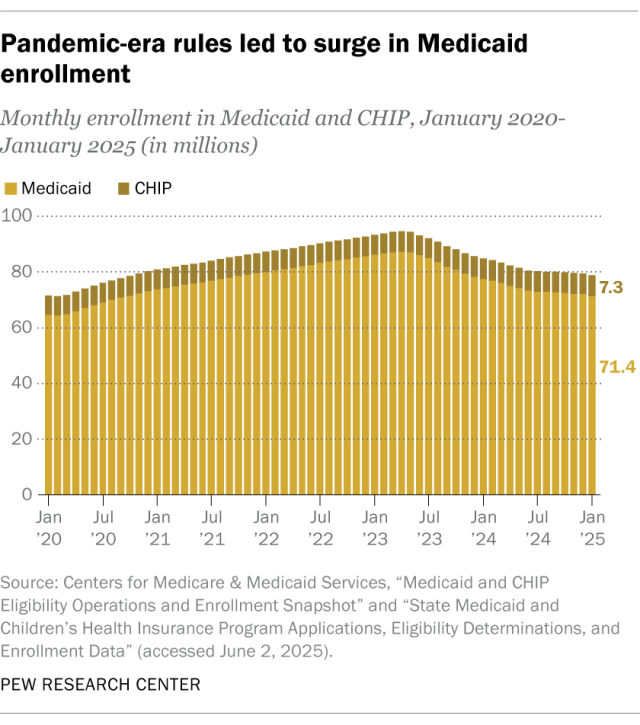
As of January 2025, 71.4 million people were enrolled in Medicaid, according to preliminary CMS data. An additional 7.3 million were enrolled in CHIP. Together, the two programs covered nearly 41.4 million adults and 37.4 million children, or 23% of the U.S. population.
Children are covered by Medicaid at a higher rate than adults. We estimate that 41% of all U.S. children were enrolled in Medicaid and 10% were enrolled in CHIP as of January. The two programs combined provided health coverage to more than half of the country’s 73.1 million children. By comparison, Medicaid enrolled 15% of the U.S. adult population as of January.
How has Medicaid enrollment changed over time?
While the long-term trend has been upward, Medicaid enrollment has remained relatively steady for the past several years at around 20% of the U.S. population.
Medicaid enrollment counts are affected by factors including population growth and general economic conditions, since more people become eligible in downturns as they lose jobs and income. But policy changes play a significant role as well: Congress and individual states can expand or restrict eligibility rules and, separately, make it easier or harder for people to enroll and maintain their eligibility status.
During the COVID-19 pandemic, for example, Congress gave states extra money for their Medicaid programs on the condition that they maintain coverage for nearly everyone who was already enrolled in the program (rather than periodically rechecking their eligibility, as is normally required). This “continuous coverage” rule led to a steep rise in enrollment, from 64.8 million in March 2020 to a peak of 87.4 million in April 2023 – an increase of 34.8%.
The extra funds began to phase out in April 2023 and ended completely, along with the continuous coverage requirement, that December. Medicaid enrollment has fallen steadily since then, to 21% of the U.S. population as of January 2025.
How do Medicaid enrollment rates vary around the country?
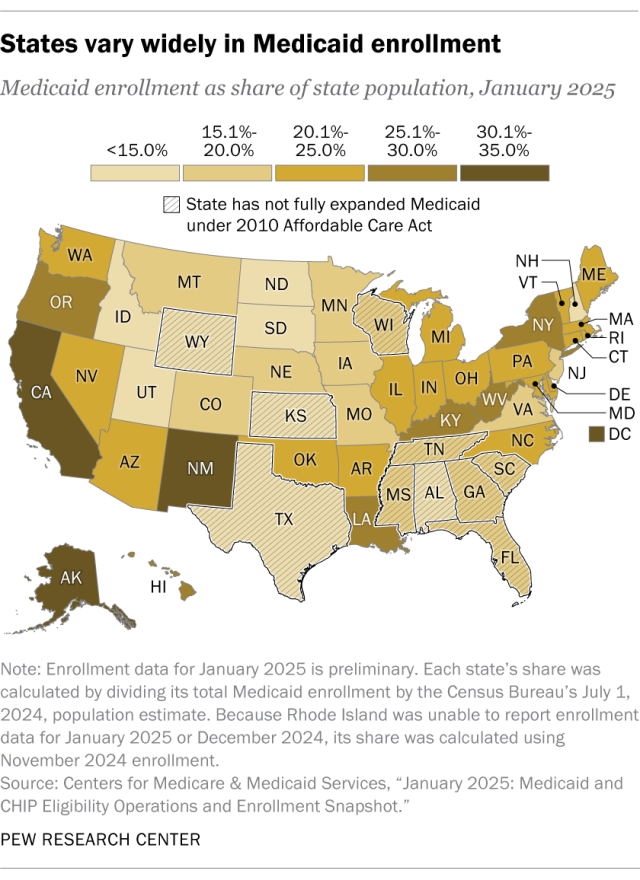
In January 2025, by our calculations, Medicaid enrollment ranged from a high of 34.2% of the population in D.C. to a low of 8.6% in Utah. Enrollment in CHIP ranged from 4.4% in Oregon to 0.1% in Minnesota. Again, state enrollment rates in these programs depend on factors including local economic conditions and each state’s eligibility rules.
Detailed table: Medicaid enrollment by state in January 2025
What are the demographics of Medicaid enrollees?
Here’s some of what we know, based on 2023 data from the Current Population Survey’s Annual Social and Economic Supplement, or ASEC. (Note that ASEC defines Medicaid to include CHIP and a handful of other state-administered programs for low-income people.)
- Women account for just over half of Medicaid enrollees (52.2%), slightly higher than their share of the overall U.S. population (50.7%).
- Non-Hispanic White enrollees account for 39.6% of all Medicaid recipients (versus 58.0% of the U.S. population as a whole). Hispanic people, who can be of any race, comprise 30.8% of enrollees (versus 19.7% of the population), and Black people make up 20.8% of enrollees (versus 13.5% of the population). The share of Asian American enrollees (6.0%) was about the same as their share of the overall population (6.6%).
- Medicaid enrollees ages 19 to 64 are more likely than Americans in that age group overall to have never been married (47.9% vs. 36.3%) or to be divorced or separated (14.8% vs. 11.1%). They’re much less likely than Americans overall to be currently married (34.9% vs. 51.0%).
- Nearly half of enrollees (48.6%) have household incomes of less than $50,000, compared with 23.8% of the general population.
- More than half (57.2%) of enrollees ages 26 to 64 have a high school diploma or less, compared with 34.9% of the population in that age group.
- 17.0% of enrollees rate their health status as “fair” or “poor,” compared with 11.2% of all people surveyed.
- 84.2% of Medicaid enrollees were born in the United States, 6.6% are naturalized citizens and 9.2% are foreign-born noncitizens. Those shares are all similar to the U.S. population as a whole. Only some noncitizens are eligible for Medicaid; unauthorized immigrants are not eligible for the program.
Are Medicaid enrollees required to work?
In most cases, no. But under the budget legislation pending in Congress, people who qualify for Medicaid under the 2010 Affordable Care Act expansion would have to work, do community service or go to school to retain their eligibility. (Georgia operates a pilot work requirement under a waiver approved during the first Trump administration.)
In a recent Pew Research Center survey, 49% of U.S. adults said they would favor work requirements for most adults who get health insurance through Medicaid, while 32% would oppose such requirements and 18% weren’t sure.
Most working-age adult enrollees in Medicaid already work, according to a May 2025 analysis by KFF.
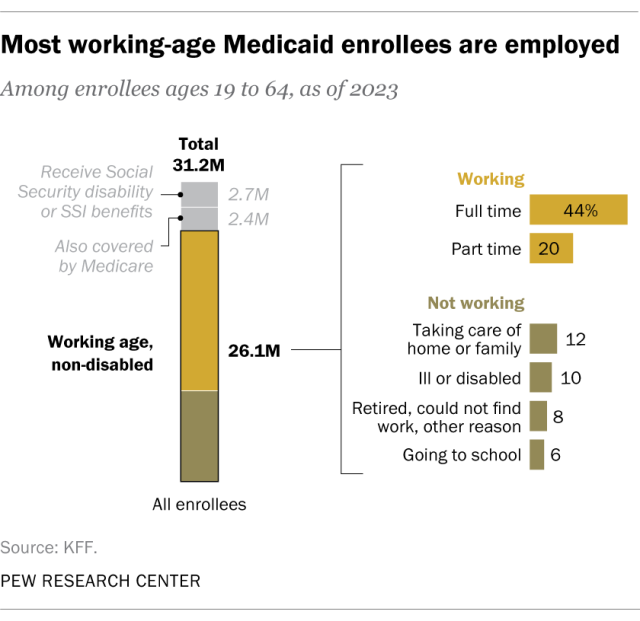
Just over 31.2 million people ages 19 to 64 were enrolled in Medicaid in 2023, KFF found. More than 2.4 million of them were also covered by Medicare, and 2.7 million received disability benefits from Social Security or Supplemental Security Income benefits. Excluding those two groups of people, who presumptively have disabilities that would exempt them from the work requirements, leaves 26.1 million enrollees. Among that group, 11.5 million worked full time (44.1%) and 5.1 million worked part time (19.5%).
Of the 9.5 million people who didn’t work, 3.2 million cited caregiving responsibilities as a reason, while 1.7 million said they were in school and 2.6 million cited illness or disability.
How much does Medicaid cost?
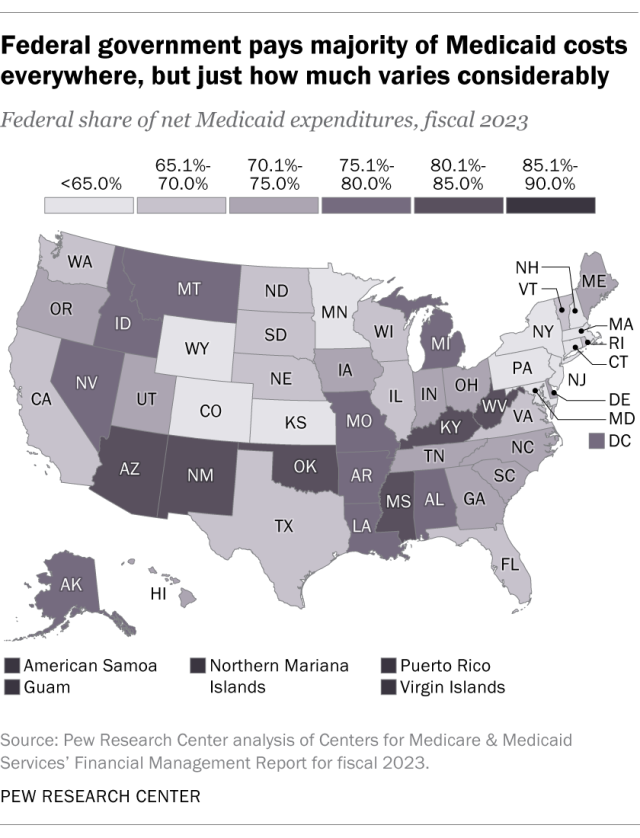
In fiscal 2023, the most recent year for which detailed financial information is available, Medicaid’s net cost was $894.2 billion. The federal government paid just over two-thirds of that figure ($614.0 billion, or 68.7%), while states, D.C. and territories paid the rest ($280.2 billion, or 31.3%).
Under Medicaid, states pay health care providers up front. The federal government then reimburses states for part of those costs. Those federal payments are a lot larger in some states than others. In fiscal 2023, for example, the federal government paid for 82.1% of New Mexico’s program, 71.0% of Tennessee’s and 59.7% of Wyoming’s. The federal shares of the territories’ programs were all 85% or higher.
The federal matching rates vary because they’re based largely on each state’s per-capita income and are recalculated each year based on new data. In addition, certain services and subgroups of enrollees are reimbursed at their own specific rates.
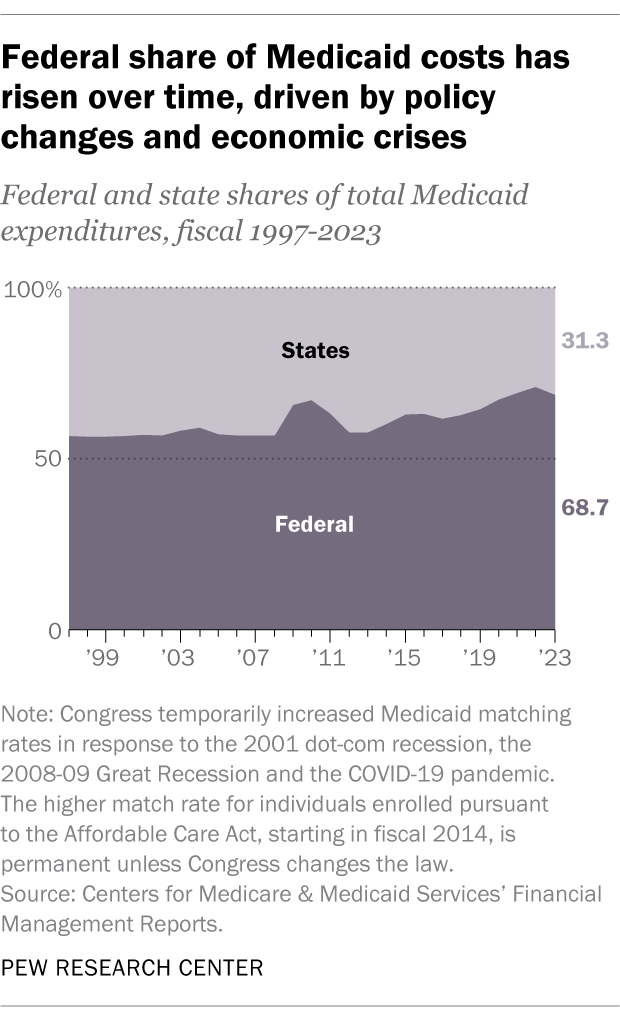
Historically, the federal government’s overall share of Medicaid costs has hovered between 56% and 59%, though Congress has often raised matching rates temporarily during economic downturns.
The federal share rose above 60% and stayed there after the Affordable Care Act expanded Medicaid eligibility. During the COVID-19 pandemic, when Congress authorized extra payments to states for retaining people on the rolls, the federal share reached as high as 71% (in fiscal 2022).
How much of federal and state budgets go to Medicaid?
In fiscal 2024, Medicaid represented about 8% of all federal spending, according to archived data from the Office of Management and Budget. This was down from a peak of 10% the year before. Medicaid’s share of federal spending grew steadily from the program’s inception until the 2004 fiscal year, and since then it has bounced around more erratically.
State spending on Medicaid varies considerably. Because much of what states spend on Medicaid is ultimately reimbursed by the federal government, a better way to analyze the program’s budget impact is to look only at “locally raised dollars” spent on Medicaid as a share of all locally raised money spent. (We’re using “locally raised dollars” to mean money raised by state and local taxes, fees and assessments, or borrowed by states, whether held in their general funds or other specialized funds.)
Considered that way, Missouri spent the most in fiscal 2023. It spent 25.5% of its locally raised dollars on Medicaid, according to data from the National Association of State Budget Officers. Hawaii spent the least of any state at 5.7% of its locally raised dollars.
Where does all that money go?
In fiscal 2023, a total of $884.4 billion was spent on medical services through Medicaid, according to our analysis of CMS financial data. (That figure includes rebates and offsets of various kinds but excludes $24.5 billion collected from patients and third parties. Net spending on services was $859.9 billion.)
More than half of that money ($460.6 billion, or 52.1%) went to managed-care organizations, or MCOs. Most Medicaid beneficiaries – 85% in 2022 – are enrolled in some type of managed-care plan. Under such plans, states contract with MCOs and pay a fixed monthly fee per enrollee. The MCO then either provides health care services to beneficiaries itself or pays providers to do so.
Almost $112.8 billion (or 12.8%) was spent on home- and community-based long-term care services, while another $60.4 billion (or 6.8%) went for institutional long-term care. All told, 19.6% of all Medicaid spending went to long-term care.
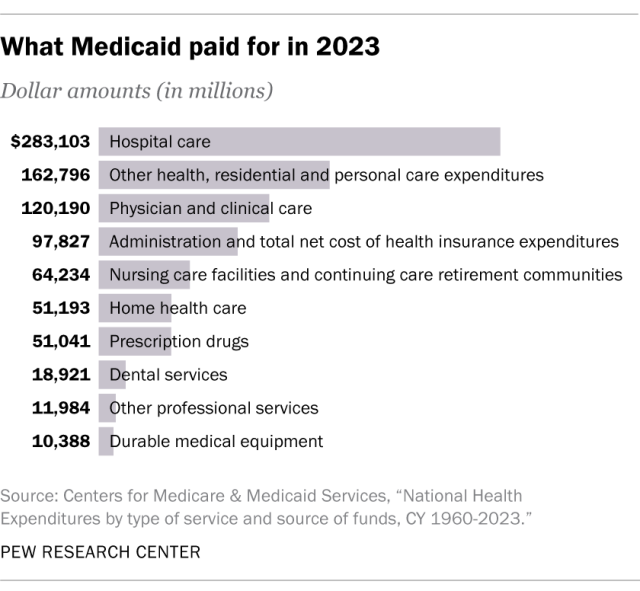
Another $87.9 billion, or nearly 10%, went to hospitals, and $18.8 billion (2.1%) went toward prescription drugs. About $27.6 billion (3.1%) went to pay Medicare premiums and copays for low-income elderly people who receive both Medicaid and Medicare benefits.
In addition, $34.4 billion went to federal and state administrative expenses, amounting to 3.8% of net spending.
How big a role does Medicaid play in U.S. health care overall?
In 2023, Medicaid accounted for 17.9 cents of every dollar spent on health care in the United States, according to health expenditure data from CMS. Excluding medical research and spending on buildings and medical equipment – which Medicaid doesn’t pay for at all – the program paid 18.8 cents of every dollar spent on health care services. Since about 1990, Medicaid’s share of overall health spending has mostly grown, albeit in fits and starts.
Medicaid is a much more significant player in particular areas. For example, in 2023, more than a third of home health care spending and nearly a third of spending on nursing homes came via Medicaid, according to CMS. That same year, Medicaid paid for 41% of births in the country, according to data from the Centers for Disease Control and Prevention.
