
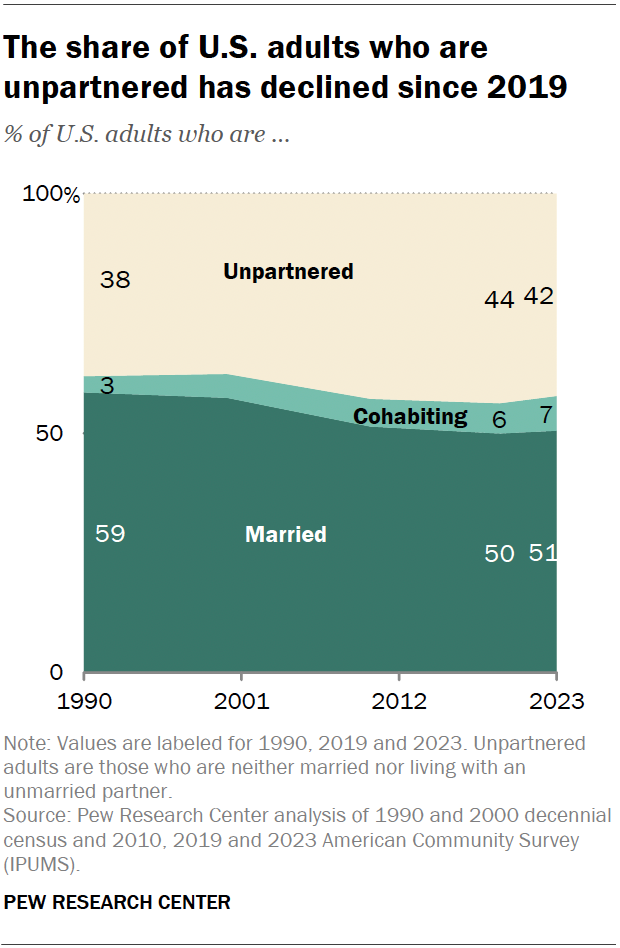
After rising for about 20 years, the share of U.S. adults who are not living with a spouse or partner has modestly declined since 2019. In 2023, 42% of adults were unpartnered, down from 44% in 2019, according to a new Pew Research Center analysis of Census Bureau data.
The share of adults who were married increased from 50% to 51% from 2019 to 2023. The share of adults cohabiting with an unmarried partner also increased, from 6% to 7%.
The decline since 2019 in the share of adults who are unpartnered has occurred across all age groups.
Pew Research Center conducted this analysis as part of its ongoing research documenting important trends in American family life.
This analysis uses decennial census data and the American Community Survey (ACS). The ACS is the largest household survey in the United States, with a sample of more than 3 million addresses. Collected by the U.S. Census Bureau since 2001, it covers the topics previously included in the long form of the decennial census. The ACS estimates the size and characteristics of the nation’s resident population.
The microdata files used for this analysis were provided by the Integrated Public Use Microdata Series (IPUMS) from the University of Minnesota. IPUMS standardizes variable names and coding across years as much as possible, making it easier to analyze the data over time.
The analysis begins in 1990 because that was the first census that tracked unmarried partners of the household head.
2020 ACS data is not used in this analysis because of data quality issues due to the COVID-19 pandemic.
Census and ACS data slightly overestimate the size of the unpartnered population. The ACS does not capture all cohabiting relationships. The ACS only identifies cohabiting partnerships that include the household head. Most cohabiting relationships do involve the household head.
Another Census data product, the Current Population Survey Annual Social and Economic Supplement (ASEC), does capture all cohabitors. In the 2024 ASEC, 93% of all cohabiting adults are either the household head or the unmarried partner of the head. Since the ASEC began tracking all cohabiting relationships in 2007, we used the Census and ACS for the longer historical trend it provides.
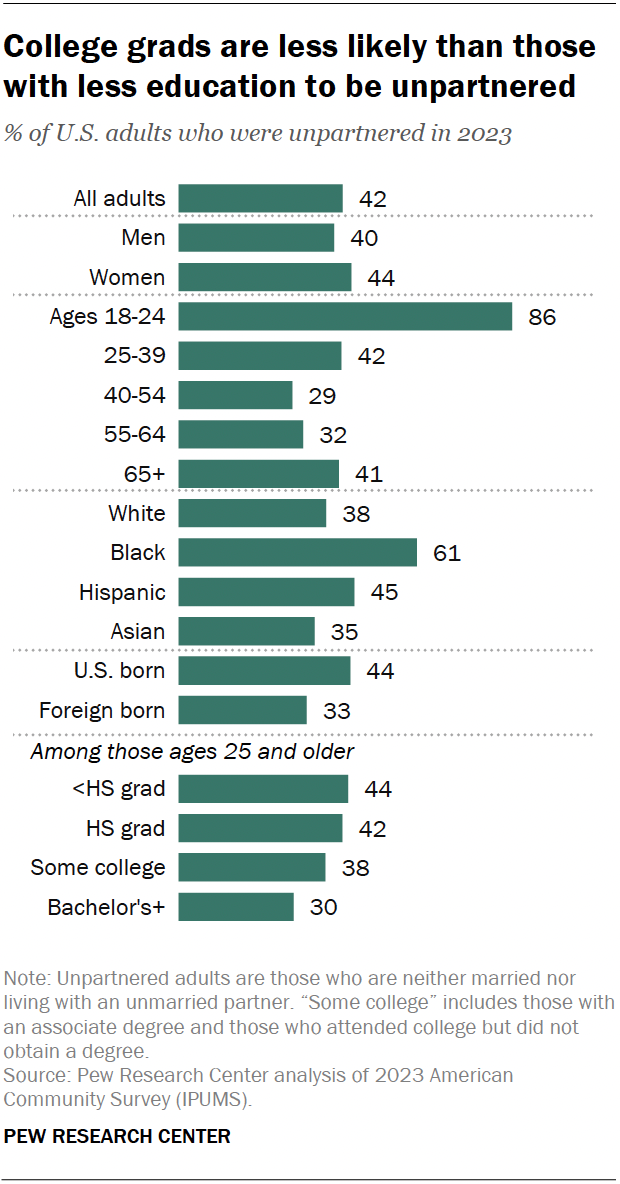
However, certain demographic groups are more likely than others to be unpartnered, as of 2023:
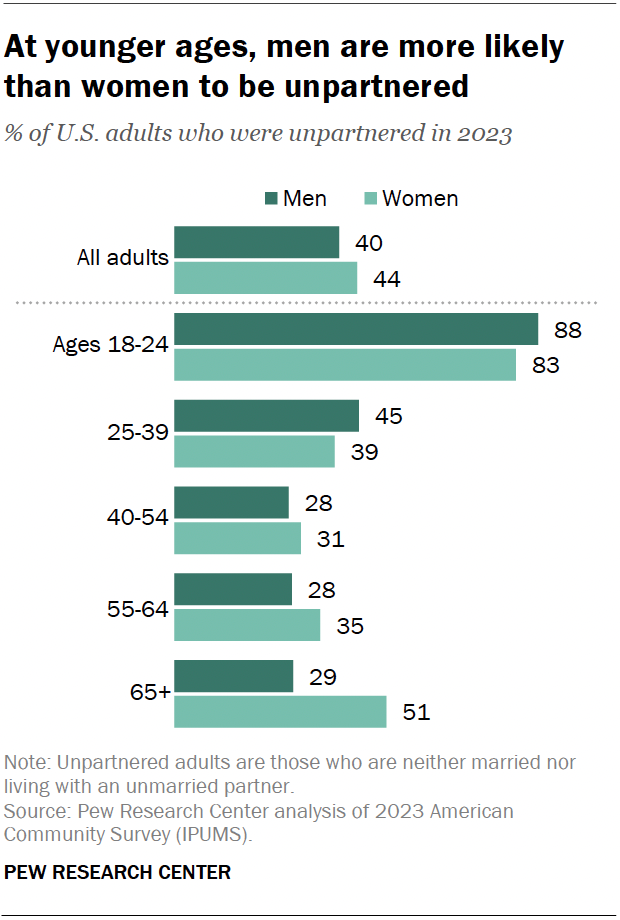
- Gender: Women are more likely than men to be unpartnered (44% vs. 40%).
- Age: 86% of adults 18 to 24 are unpartnered – far more than among 25- to 39-year-olds (42%), 40- to 54-year-olds (29%), 55- to 64-year-olds (32%) or those 65 and older (41%).
- Gender and age: Men younger than 40 are more likely than women in this age group to be unpartnered. But among those 40 and older, women are more likely to be unpartnered. For example, 51% of women 65 and older are unpartnered, compared with only 29% of men in the same age group.
- Race and ethnicity: 61% of Black adults are unpartnered, compared with 45% of Hispanic adults, 38% of White adults and 35% of Asian adults.
- Nativity: 44% of U.S.-born adults and 33% of foreign-born adults are unpartnered.
- Education: 44% of adults ages 25 and older without a high school diploma are unpartnered, whereas 30% of those with at least a bachelor’s degree are.
Economic outcomes for partnered and unpartnered adults
Unpartnered adults tend to be less successful economically than those living with a spouse or partner. Our prior research shows that the median earnings of single adults ages 25 to 54 lag their partnered peers. Single men are also much less likely than partnered men to be employed.
In addition, a 2023 Federal Reserve survey shows that unpartnered adults tend to be financially worse off than partnered adults. Some 64% of unpartnered adults said they were doing at least OK financially, compared with 77% of partnered adults.
Why is the share of unpartnered adults decreasing?
Even though the share of adults who are unpartnered has ticked down and the share who are married has inched up, it is not the case that more people are getting married.
Since 2008, the Census Bureau has collected data on the number of people who say they’ve gotten married or divorced in the previous 12 months. That data does not show an uptick in the rate of new marriages, but it does show fewer divorces. Since 2009, divorce peaked in 2012 as 2.0% of married adults divorced in the prior year. In 2023, a record-low 1.4% of married adults got divorced.
