
Pew Research Center has conducted many surveys about abortion over the years, asking whether Americans believe the procedure should be legal and delving into related questions.
In a January 2026 survey, 60% of U.S. adults said abortion should be legal in all or most cases, while 38% said it should be illegal in all or most cases. The survey was conducted nearly four years after the Supreme Court overturned Roe v. Wade, ending the federal constitutional right to abortion.
Another survey, conducted a few months before the court’s 2022 decision, showed that relatively few Americans take an absolutist view on the issue.
Below are answers to common questions about abortion in the United States, based on data from two organizations that have long collected data about it: the U.S. Centers for Disease Control and Prevention (CDC) and the Guttmacher Institute. (The data we cite for both organizations precedes the Supreme Court decision from four years ago.)
- How many abortions are there in the U.S. each year?
- How has the number of abortions in the U.S. changed over time?
- What is the abortion rate among women in the U.S.? How has it changed over time?
- What are the most common types of abortion?
- How many abortion providers are there in the U.S., and how has that number changed?
- What percentage of abortions are for women who live in a different state from the abortion provider?
- What are the demographics of women who have had abortions?
- When during pregnancy do most abortions occur?
- How often are there medical complications from abortion?
How many abortions are there in the U.S. each year?
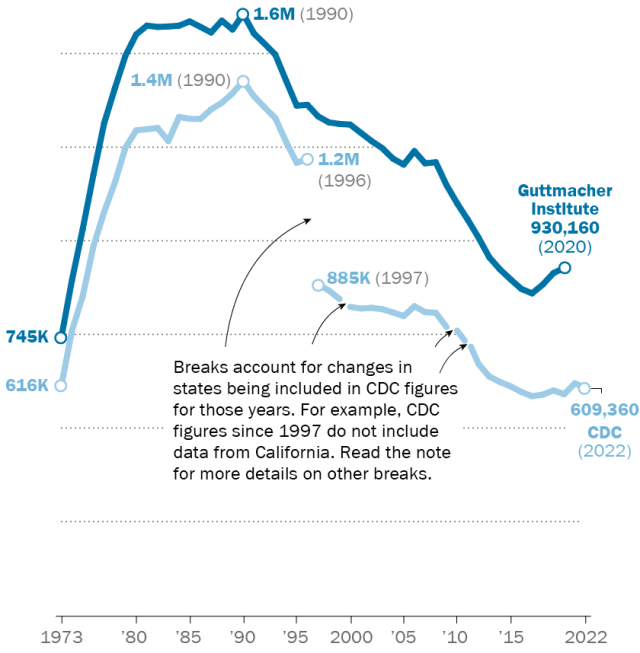
An exact answer is hard to come by. Both the CDC and Guttmacher Institute have tried to measure abortions for around half a century, but they use different methods and publish different figures.
The CDC uses data that is voluntarily reported by states’ central health agencies, including separate figures for New York City and the District of Columbia. It hasn’t received abortion data from certain states – including California, the most populous state – since the mid-1990s. As a result, its annual figures are typically a lot lower than Guttmacher’s.
The last year for which the CDC reported an annual national total was 2022. There were 613,383 abortions in D.C. and the 46 states that reported data that year, down from 625,978 in those same jurisdictions in 2021, but up from 597,355 in 2020. Figures for 2023, the first full year after the Supreme Court overturned Roe v. Wade, were expected to come out in November 2025 (based on the pattern of previous releases) but have not yet been published.
The private, nonprofit Guttmacher Institute collects its data differently. Starting in 1973 and for most of the last half-century, Guttmacher has directly requested data every three years from every known abortion provider in the country, including clinics, hospitals and physicians’ offices. The last year Guttmacher reported a yearly national total was 2020. That year, it tallied 930,160 abortions in the 50 states and D.C., up from 916,460 in 2019 and 885,800 in 2018. (Since the U.S. Supreme Court’s 2022 decision to overturn Roe v. Wade, Guttmacher has shifted to publishing monthly figures based on a sample of abortion providers. These monthly samples are not directly comparable to the annual, national tallies.)
The figures reported by the CDC and Guttmacher include only legal, induced abortions conducted by clinics, hospitals or physicians’ offices, or those involving abortion pills dispensed by certified facilities such as clinics or physicians’ offices. They do not account for the use of abortion pills obtained outside of clinical settings.
While the Guttmacher Institute supports abortion rights, its empirical data on abortions in the U.S. has been widely cited by groups and publications across the political spectrum, including by several that disagree with its positions.
How has the number of abortions in the U.S. changed over time?
| Year | Guttmacher | CDC |
|---|---|---|
| 1973 | 744,600 | 615,831 |
| 1974 | 898,600 | 763,476 |
| 1975 | 1,034,200 | 854,853 |
| 1976 | 1,179,300 | 988,267 |
| 1977 | 1,316,700 | 1,079,430 |
| 1978 | 1,409,600 | 1,157,780 |
| 1979 | 1,497,700 | 1,251,920 |
| 1980 | 1,553,900 | 1,297,610 |
| 1981 | 1,577,300 | 1,300,760 |
| 1982 | 1,573,900 | 1,303,980 |
| 1983 | 1,575,000 | 1,268,990 |
| 1984 | 1,577,200 | 1,333,520 |
| 1985 | 1,588,600 | 1,328,570 |
| 1986 | 1,574,000 | 1,328,110 |
| 1987 | 1,559,100 | 1,353,670 |
| 1988 | 1,590,800 | 1,371,280 |
| 1989 | 1,566,900 | 1,396,660 |
| 1990 | 1,608,600 | 1,429,580 |
| 1991 | 1,556,500 | 1,388,940 |
| 1992 | 1,528,900 | 1,359,140 |
| 1993 | 1,500,000 | 1,330,410 |
| 1994 | 1,431,000 | 1,267,420 |
| 1995 | 1,363,700 | 1,210,880 |
| 1996 | 1,365,700 | 1,221,580 |
| 1997 | 1,335,000 | 885,624 |
| 1998 | 1,319,000 | 870,184 |
| 1999 | 1,314,800 | 847,283 |
| 2000 | 1,313,000 | 826,123 |
| 2001 | 1,291,000 | 821,850 |
| 2002 | 1,269,000 | 823,534 |
| 2003 | 1,250,000 | 820,052 |
| 2004 | 1,222,100 | 811,381 |
| 2005 | 1,206,200 | 801,577 |
| 2006 | 1,242,200 | 827,888 |
| 2007 | 1,209,600 | 812,273 |
| 2008 | 1,212,400 | 810,403 |
| 2009 | 1,151,600 | 772,630 |
| 2010 | 1,102,700 | 762,755 |
| 2011 | 1,058,500 | 727,554 |
| 2012 | 1,011,000 | 673,634 |
| 2013 | 958,700 | 640,154 |
| 2014 | 926,200 | 625,668 |
| 2015 | 899,500 | 613,911 |
| 2016 | 874,100 | 599,001 |
| 2017 | 862,320 | 587,611 |
| 2018 | 885,800 | 591,884 |
| 2019 | 916,460 | 603,168 |
| 2020 | 930,160 | 592,939 |
| 2021 | — | 622,108 |
| 2022 | — | 609,360 |
The annual number of U.S. abortions rose for years after the Supreme Court legalized the procedure nationwide in its 1973 decision in Roe v. Wade. It peaked in the late 1980s and early 1990s at about 1.4 million per year according to the CDC and around 1.6 million according to Guttmacher. Since then, abortions have generally decreased at what a CDC analysis called “a slow yet steady pace” even though the number of U.S. women ages 15 to 44 has risen.
Guttmacher estimates that the number of abortions in the U.S. in 2020 was 40% lower than in 1991. According to the CDC, the number of abortions was 37% lower in 2022 than in 1991, looking just at D.C. and the 46 states that reported data for both years.
(The line chart in this section of our analysis shows the long-term trend in the number of legal abortions reported by both the CDC and Guttmacher. To allow for consistent comparisons over time, the CDC figures in the chart have been adjusted to ensure that the same states are counted from one year to the next. Using that approach, the CDC figure for 2022 is 609,360 legal abortions.)
There have been occasional breaks in this long-term pattern of decline in abortions – during the middle of the first decade of the 2000s, for example, and again in the late 2010s. Since 2017, the CDC’s figures have fluctuated from year to year, while Guttmacher reported an 8% increase in abortions from 2017 to 2020.
As noted above, these figures do not include abortions using pills obtained outside of clinical settings.
What is the abortion rate among women in the U.S.? How has it changed over time?
The abortion rate – which accounts for population change in the U.S. – has generally gone down since 1980. Guttmacher says there were 14.4 abortions per 1,000 women ages 15 to 44 in 2020, down from 29.3 per 1,000 in 1981.
The CDC’s figures tell a similar story over the long term. The agency’s data for 2022 shows 11.2 abortions per 1,000 women ages 15 to 44, down from 25 per 1,000 in 1980. (The 2022 CDC figures exclude data from California, Maryland, New Hampshire, New Jersey and D.C., while the 1980 figures include data from all states and D.C.)
Guttmacher reported that the abortion rate increased slightly between 2017 and 2020, while CDC data shows the rate fluctuating between 11.0 and 12.0 since 2014.
What are the most common types of abortion?
| Surgical | With pills | |
|---|---|---|
| 2006 | 88 | 11 |
| 2007 | 86 | 12 |
| 2008 | 85 | 14 |
| 2009 | 82 | 16 |
| 2010 | 81 | 18 |
| 2011 | 79 | 19 |
| 2012 | 78 | 22 |
| 2013 | 77 | 23 |
| 2014 | 76 | 24 |
| 2015 | 73 | 27 |
| 2016 | 69 | 31 |
| 2017 | 64 | 36 |
| 2018 | 60 | 40 |
| 2019 | 56 | 44 |
| 2020 | 47 | 53 |
| 2021 | 44 | 56 |
| 2022 | 42 | 58 |
The CDC broadly divides abortions into two categories: surgical abortions and medication abortions, which involve pills.
Surgical abortions conducted during the first trimester of pregnancy typically use a suction process, according to the UCLA School of Medicine. The relatively few surgical abortions that occur during the second trimester of a pregnancy typically use a process called dilation and evacuation.
When it comes to medication abortion, two pills are commonly used together. Mifepristone blocks hormones that support a pregnancy, while misoprostol then causes the uterus to empty. The Food and Drug Administration (FDA) says this combination is safe until 10 weeks into pregnancy. (The FDA is currently conducting a safety study of mifepristone.)
Since the FDA first approved abortion pills in 2000, their use has increased over time as a share of abortions nationally.
Both the CDC and Guttmacher now find that the majority of abortions in the U.S. involve pills. The CDC says that in 2022, 58% of U.S. abortions involved pills (in D.C. and the 45 states that reported data on this). Guttmacher data indicates that 53% of U.S. abortions involved pills in 2020, up from 39% in 2017.
These figures do not account for the use of pills obtained outside of clinical settings. (A 2024 study published in the Journal of the American Medical Association found that medication abortions outside of clinical settings increased in the six months after the May 2022 Supreme Court decision.)
How many abortion providers are there in the U.S., and how has that number changed?
| Year | Abortion clinics | Other clinics | Hospitals | Physicians’ offices |
|---|---|---|---|---|
| 1982 | 379 | 410 | 1405 | 714 |
| 1985 | 399 | 438 | 1191 | 652 |
| 1988 | 409 | 476 | 1040 | 657 |
| 1992 | 441 | 448 | 855 | 636 |
| 1996 | 452 | 417 | 703 | 470 |
| 2000 | 447 | 386 | 603 | 383 |
| 2005 | 381 | 435 | 604 | 367 |
| 2008 | 378 | 473 | 610 | 332 |
| 2011 | 329 | 510 | 595 | 286 |
| 2014 | 272 | 517 | 638 | 244 |
| 2017 | 253 | 555 | 518 | 261 |
| 2020 | 227 | 580 | 530 | 266 |
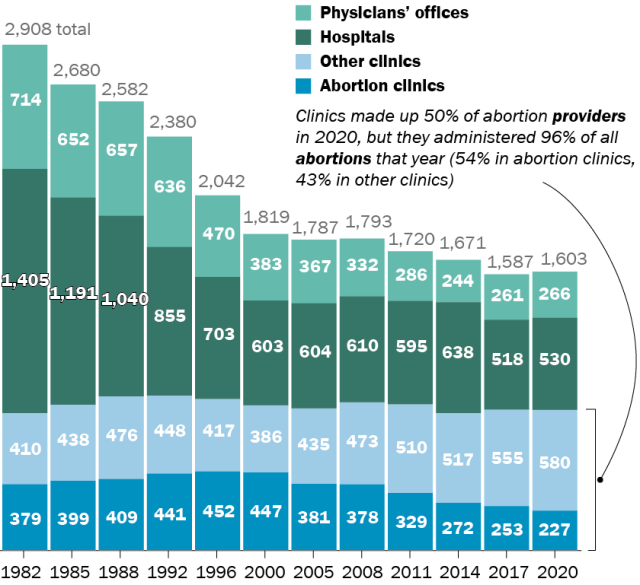
In 2020, there were 1,603 facilities that provided abortions, either through surgical procedures or the distribution of pills, according to the most recent data from Guttmacher. This included 807 clinics, 530 hospitals and 266 physicians’ offices. (The CDC does not track the number of abortion providers.)
The total number of abortion providers has declined substantially over the long term. In 1982, there were 2,908 facilities providing abortions in the U.S., including 789 clinics, 1,405 hospitals and 714 physicians’ offices, according to Guttmacher. The decrease in the number of hospitals providing abortion services accounted for most of that decline.
Clinics have played an outsize role in providing abortions in recent decades. While clinics made up half of all abortion providers in 2020, they were the site of the vast majority (96%) of abortions that year. Clinics have increased as a share of locations for abortions since the mid-1970s, when about half of all abortions occurred at them.
The number of clinics has decreased nationally since the Supreme Court’s 2022 decision to overturn Roe v. Wade. It fell from 807 in 2020 to 765 in March 2024 and 753 in December 2025. (For more details on changes to the number of clinics since the 2022 decision, read Guttmacher’s February 2026 report.)
What percentage of abortions are for women who live outside the state where the abortion took place?
In 2022, the year the Supreme Court (in June) overturned the federal constitutional right to an abortion, around one-in-six abortions conducted in a clinical setting (16.5%) were performed on women known to live outside the state where the abortion occurred, according to CDC data covering D.C. and 46 states. That was up from 10.9% in the same jurisdictions in 2021.
It was much more common for women to receive abortions outside their state of residence before the Supreme Court’s 1973 Roe v. Wade decision to allow abortion nationwide. In 1972, of all abortions for which the CDC knew the women’s state of residence, 44% were performed on women outside that state of residence. That fell to 25% in 1973 and to 13% in 1974.
What are the demographics of women who have had abortions?
Women in their 20s accounted for 57% of all women who had abortions in 2022, while those in their 30s accounted for 31%, according to CDC data covering D.C. and 46 states. Teens ages 13 to 19 accounted for 8.5%, while women ages 40 to 44 accounted for about 4%.
The vast majority of women who had abortions in 2022 – 88% – were unmarried. Married women accounted for 12%, according to data from 36 states.
When it comes to race and ethnicity, 39% of all women who had abortions in 2022 were non-Hispanic Black, according to data covering D.C. and 31 states (including all of New York State except for New York City). Another 32% were non-Hispanic White, 21% were Hispanic (of any race) and 7% were of other races.
Looking at abortion rates among women ages 15 to 44, there were 24.4 abortions per 1,000 non-Hispanic Black women in 2022; 11.6 abortions per 1,000 Hispanic women; 5.7 abortions per 1,000 non-Hispanic White women; and 9.4 abortions per 1,000 women of other races. These figures are based on data from D.C. and 31 states (again including New York but excluding New York City).
For 56% of U.S. women who had induced abortions in 2022, it was the first time they had ever had one. For a quarter, it was their second abortion. For 11%, it was their third, and for 8% it was their fourth or more. These figures include data from 41 states.
| Number of abortions | % of induced abortions |
|---|---|
| 0 | 56 |
| 1 | 25 |
| 2 | 11 |
| 3 or more | 8 |
Around four-in-ten women who had abortions in 2022 – 41% – had no previous live births at the time they had an abortion. Almost a quarter (24%) had one previous live birth, 19% had two, 9% had three and 6% had four or more. These figures are based on data from 41 states.

| Year | Zero | One | Two | Three | Four or more |
|---|---|---|---|---|---|
| 2022 | 41% | 24% | 19% | 9% | 6% |
When during pregnancy do most abortions occur?
The vast majority of abortions occur during the first trimester of a pregnancy. In 2022, 93% of abortions occurred at or before 13 weeks of pregnancy. An additional 6% occurred between 14 and 20 weeks of pregnancy, and about 1% happened at 21 weeks or more of gestation. These CDC figures include data from 40 states and New York City, but not the rest of New York.
How often are there medical complications from abortion?
About 2% of all abortions in the U.S. involve some type of complication for the woman, according to an article in StatPearls, an online healthcare resource. Most complications do not require further medical intervention or hospitalization, according to the article.
The CDC calculates case-fatality rates for women from induced abortions – that is, how many women die from abortion-related complications for every 100,000 legal abortions in the U.S. The rate was lowest during the most recent period examined by the agency (2013 to 2021), when there were 0.46 deaths to women per 100,000 legal induced abortions. The case-fatality rate reported by the CDC was highest during the first period examined by the agency (1973 to 1977), when it was 2.09 deaths to women per 100,000 legal induced abortions. During the five-year periods in between, the rate ranged from 0.52 (from 1993 to 1997) to 0.78 (from 1978 to 1982).
The CDC calculates death rates by five-year and nine-year periods because of year-to-year fluctuation in the numbers – and due to the relatively low number of women who die from legal induced abortions.
In 2021, five women in the U.S. died due to complications from induced abortions. Six women died in this way in 2020, four in 2019 and two in 2018. (These deaths all followed legal abortions.) Since 1990, the annual number of deaths among women due to legal induced abortion has ranged from two to 12.
The annual number of reported deaths from induced abortions (both legal and illegal) tended to be higher in the 1980s, when it ranged from nine to 16, and from 1972 to 1979, when it ranged from 13 to 63. One driver of the decline was the drop in deaths from illegal abortions. There were 39 deaths from illegal abortions in 1972, the last full year before Roe v. Wade. The total fell to 19 in 1973 and to single digits or zero every year after that. (The number of deaths from legal abortions has also declined since then, though with some slight variation over time.)
The number of deaths from induced abortions was considerably higher in the 1960s than afterward. For instance, there were 119 deaths from induced abortions in 1963 and 99 in 1965, according to reports by the then-U.S. Department of Health, Education and Welfare, a precursor to the Department of Health and Human Services.
Note: This is an update of a post originally published May 27, 2022.


