

Self-employed workers view their jobs more favorably than those who are not self-employed, according to a recent Pew Research Center survey of employed Americans.
Pew Research Center conducted this analysis to look at how self-employed workers are feeling about their jobs and how that compares with workers who aren’t self-employed. To do this, we surveyed 5,775 U.S. adults – including 557 who are self-employed – who have only one job or have more than one job but consider one of them to be their primary job.
To identify self-employed workers, we asked all employed adults: “Which of the following best describes where you work? A private company, a nonprofit organization, government (including federal, state, or local government, public schools, college and universities), self-employed (including business owner and independent contractor, freelance worker), other.”
All the workers who took part are members of the Center’s American Trends Panel (ATP), an online survey panel that is recruited through national, random sampling of residential addresses. Address-based sampling ensures that nearly all U.S. adults have a chance of selection. The survey is weighted to be representative of the U.S. adult population by gender, race, ethnicity, partisan affiliation, education and other categories. Read more about the ATP’s methodology.
The demographic profile of workers is based on analysis of the Current Population Survey (CPS). In the CPS, workers with multiple sources of employment are classified according to the job in which they worked the most hours. Unpaid family workers, those who are unemployed but seeking full-time or part-time work, and those who are not in the labor force are not included in this analysis.
Here are the questions used for this analysis, along with responses, and the survey’s methodology.
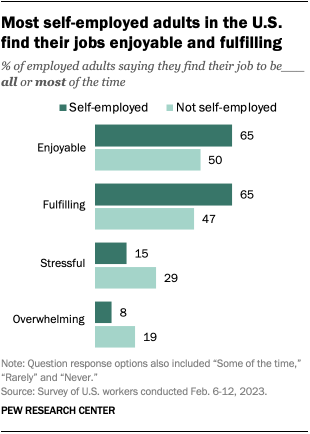
Most self-employed workers (62%) say they are extremely or very satisfied with their job, compared with 51% of those who are not self-employed. They also express higher levels of enjoyment and fulfillment with their job.
In turn, those who are not self-employed are more likely than self-employed workers to say they find their job stressful and overwhelming.
Some 48% of self-employed workers say their contributions at work are valued a great deal, compared with a quarter of those who are not self-employed.
There are also important differences in when and where self-employed workers do their jobs:
- 47% of self-employed workers say their job can mostly be done from home, compared with 38% of those who are not self-employed.
- 60% of self-employed workers with jobs that can be done from home say they work from home all of the time, compared with 32% of those who are not self-employed.
- A larger share of self-employed workers (52%) than those who are not self-employed (28%) say they respond to emails or other messages from work outside of normal work hours.
How the self-employed workforce differs from the U.S. workforce overall
About 15 million U.S. workers are self-employed, making up about 10% of the U.S. workforce, based on a Pew Research Center analysis of government data.
Roughly three-quarters of self-employed workers (76%) work full time, and 24% work part time. Among all workers, 84% work full time while 16% work part time.
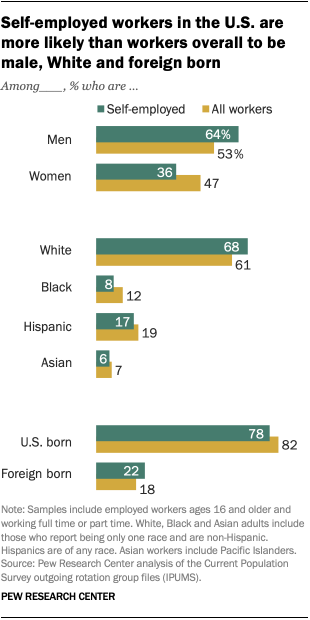
Self-employed workers are more likely than U.S. workers overall to be male, White and foreign born:
- Men make up 64% of the self-employed workforce, compared with 53% of workers overall.
- White workers make up 68% of self-employed Americans, compared with 61% of workers overall.
- Foreign-born workers make up 22% of the self-employed workforce, a slightly higher share than among all U.S. workers (18%).
Note: Here are the questions used for this analysis, along with responses, and the survey’s methodology.
