

June marked the sixth anniversary of the Supreme Court ruling that guaranteed the right of same-sex couples to marry in the United States. Data released earlier this year by the Census Bureau found that there were 568,000 same-sex married couples in the U.S. in 2019. A new Pew Research Center analysis of that data finds that adults – and particularly men – who are in same-sex marriages have a somewhat different demographic profile from adults in opposite-sex marriages.
The analysis looked at adults ages 18 and older who were married in the past 10 years, to control for potential differences due to the recency of marriages.
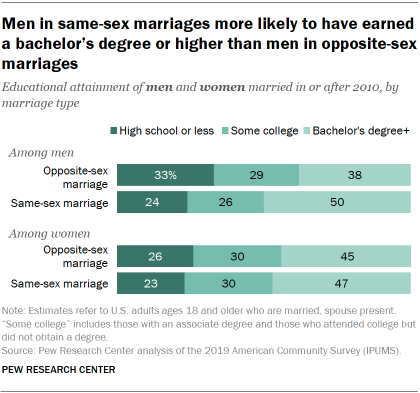
Men in same-sex marriages have higher levels of education and higher annual incomes than men who are married to opposite-sex partners. Half of men in same-sex marriages have at least a bachelor’s degree, compared with 38% of men in opposite-sex marriages. The share of women who have earned a bachelor’s degree or higher is similar for those in same-sex (47%) and opposite-sex marriages (45%).
The availability of more accurate data about same-sex marriages allows for a comparison of adult men and women in same-sex and opposite-sex marriages across key demographic measures. This analysis, which looks at the demographic characteristics of spouses who were married in 2010 or later, is based on the 2019 American Community Survey (ACS), the largest household survey in the United States, with a sample of more than 3 million addresses. It covers the topics previously covered in the long form of the decennial census. The ACS is designed to provide estimates of the size and characteristics of the nation’s resident population, which includes persons living in households and group quarters.
The specific 2019 ACS 1% microdata sample utilized was provided by the Integrated Public Use Microdata Series (IPUMS) from the University of Minnesota. IPUMS assigns uniform codes, to the extent possible, to data collected in the ACS.
The analysis only includes adults ages 18 and older who were married, spouse present, in 2019. In order to account for the recency of marriage, only spouses who were married as of 2010 or thereafter are included. It is not possible to identify the sex of a respondent’s spouse if the respondent’s spouse is absent from the household. Marriages that don’t involve the head of the household are included in the analysis. The sample had about 5,300 unweighted men in a same-sex marriage and a similar number of same-sex spouses who were women. IPUMS makes it easier to analyze spouses because the spouse record includes not only that person’s own characteristics but also those of his/her partner.
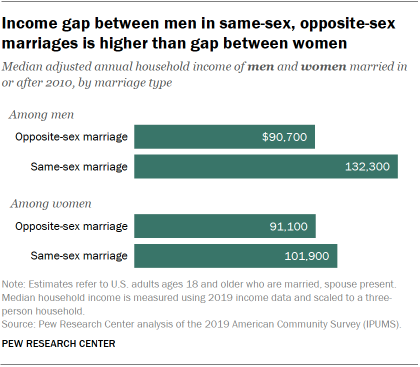
Men in same-sex marriages also have higher incomes, overall, than their counterparts in opposite-sex marriages. The median adjusted annual household income for men in same-sex marriages was roughly $132,300 in 2019, significantly higher than the median income for men in opposite-sex marriages ($90,700). There is a more modest income gap among married women. Those in same-sex marriages had a median income of roughly $101,900; this compares with about $91,100 for women in opposite-sex marriages.
When it comes to employment, men in opposite-sex marriages are more likely to be employed than those in same-sex marriages (89% vs. 80%), while the reverse is true for women: Women in same-sex marriages (76%) are more likely to be employed than their counterparts in opposite-sex marriages (72%).
The racial and ethnic profile of men in same-sex marriages is similar to that of men in opposite-sex marriages, but there are some differences among women. Women in same-sex marriages are more likely to be non-Hispanic White than women in opposite-sex marriages (69% vs. 63%), and they are less likely to be Asian or Hispanic.
Both men and women in same-sex marriages are more likely than their peers in opposite-sex marriages to be married to someone of a different race or ethnicity. Among men, 28% in same-sex marriages are intermarried, compared with 16% of men in opposite-sex marriages. The same is true among women: 20% of women in same-sex marriages are intermarried (vs. 16% of women in opposite-sex marriages).
Among men, those in same-sex marriages (24%) are slightly more likely than those in opposite-sex marriages (21%) to have been born outside the U.S. For women, on the other hand, those in opposite-sex marriages are about twice as likely as those in same-sex marriages to be foreign born (21% vs. 10%).
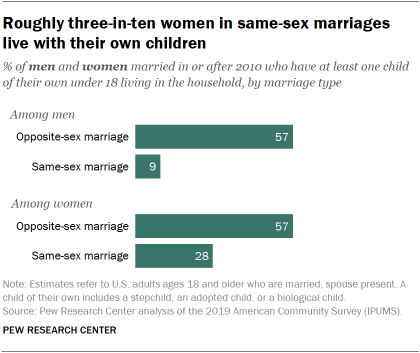
There are also some differences in family composition between adults in same-sex vs. opposite-sex marriages. Men and women in opposite-sex marriages are much more likely to be living with their own children younger than 18 than are their peers in same-sex marriages. Some 57% of men in opposite-sex marriages are living with their children, compared with only 9% of men in same-sex marriages. The gap closes for women: 57% of women in opposite-sex marriages live with their children in their household, which is about twice the share of women in same-sex marriages (28%).

