
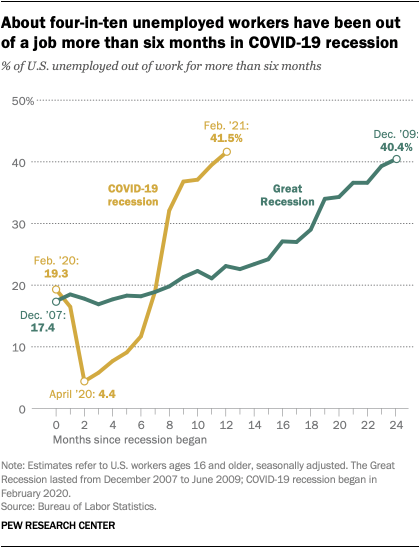
As the U.S. economy copes with the effects of the coronavirus outbreak, a rapidly rising share of unemployed Americans find themselves out of a job despite many months of searching. Even amid signs of improvement in the U.S. labor market overall, about four-in-ten unemployed workers had been out of work for more than six months in February 2021, about double the share in February 2020. At the same time, a growing number of job seekers are becoming discouraged, leaving the labor force entirely, according to a new Pew Research Center analysis of government data.
The coronavirus outbreak continues to adversely impact millions of American workers. Pew Research Center conducted this analysis to look at those groups of workers who have struggled the most to find employment during the current recession.
The main data source for this analysis is the Current Population Survey (CPS). The CPS is the U.S. government’s official source for monthly estimates of unemployment. Seasonally adjusted long-term unemployment data were extracted directly from the Bureau of Labor Statistics, while other estimates were tabulated from the CPS. Some of the CPS microdata files used in this report are the Integrated Public Use Microdata Series (IPUMS-CPS) provided by the University of Minnesota.
The COVID-19 outbreak has affected data collection efforts by the U.S. government in its surveys, limiting in-person data collection and affecting the response rate. It is possible that some measures of labor market activity and how they vary across demographic groups are affected by these changes in data collection. For example, in January 2021, the unemployment rate may have been as high as 7.3%, instead of the 6.8% officially reported on a nonseasonally adjusted basis, if an adjustment is made for measurement errors, per BLS reports.
The “long-term unemployed” are those who have been jobless for 27 weeks or more.
“Discouraged workers” are those who are not currently looking for work because they believe that there are no jobs available to them or that there are none for which they meet the qualifications.
The “U-3 rate” is the number of jobless workers actively seeking work as a share of workers either at work or actively seeking work.
The “U-4 rate” is the number of jobless workers actively seeking work and discouraged workers as a share of workers either at work, actively seeking work or discouraged from the labor force.
Seasonally adjusted figures are used for the overall trend in long-term unemployment; long-term unemployment by demographic groups uses nonseasonally adjusted figures.
References to White, Black and Asian American workers include only those who are not Hispanic and identify as only one race. Hispanic workers are of any race.
References to college graduates or people with a college degree comprise those with a bachelor’s degree or more. “Some college” includes those with an associate degree and those who attended college but did not obtain a degree.
The number of Americans who are out of work and have experienced long-term unemployment – that is, those who have been looking for a job for more than six months – has increased considerably in the year since the start of the COVID-19 recession. By February 2021, 4.1 million Americans were among the long-term unemployed, without work since at least August, making up 2.6% of the workforce overall. The sharp rise in long-term unemployment in the current recession stands in stark contrast to the Great Recession of 2007-09, when it took nearly two years for the long-term unemployment rate to reach similar heights. Job losses during the coronavirus recession have affected some demographic groups more than others, and the rise in long-term unemployment has been greater among Asian American unemployed workers, especially men.
Likewise, the ranks of discouraged workers – unemployed workers who are currently not looking for work because they believe no jobs are available for them or there are none for which they qualify – have swelled in recent months. About 529,000 Americans were classified as discouraged workers in February 2021, roughly 100,000 more than the number one year ago.
Here are five facts about unemployed Americans who have struggled more than most to return to work.
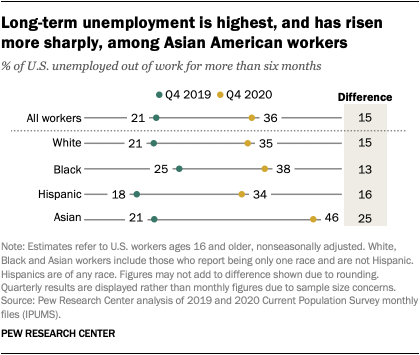
Long-term unemployment rose more sharply among Asian American workers who are unemployed. In the fourth quarter of 2020, nearly half of unemployed Asian workers (46%) had been out of work for more than six months, compared with 21% in the fourth quarter of 2019. Black unemployed workers had the next highest long-term unemployment rate (38%) at the end of 2020, followed by White (35%) and Hispanic (34%) unemployed workers. For these three groups of unemployed workers, the long-term unemployment rate was around 15 percentage points higher than one year earlier.
These patterns differ from the percent of all workers who are unemployed regardless of duration. Black workers (9.8%) had the highest unemployment rate overall in the fourth quarter of 2020, followed by Hispanic (8.7%), Asian (6.3%) and White workers (5.1%).
The reason for the relatively high long-term unemployment rate among Asian unemployed workers is not entirely clear. But it may be partially explained by the fact that they tend to be disproportionately represented in states most impacted by coronavirus shutdowns. Nearly a third of Asian Americans (31%) lived in California in 2019, a state that had some of the longest shutdowns and most severe outbreaks in 2020. New York is the state with the second largest share of the Asian population (9%) and suffered the third most employment losses since the start of the pandemic.
Among the unemployed, bachelor’s degree holders and older workers have higher long-term unemployment rates. In the fourth quarter of 2020, 41% of unemployed workers with a bachelor’s degree or more education had been out of work for more than six months, compared with about one-in-three unemployed workers with less than a high school education. College-educated unemployed workers also saw a greater increase in the long-term unemployment rate since the end of 2019.
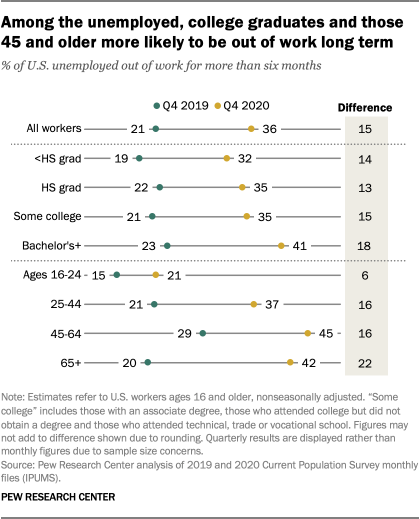
Similarly, unemployed workers ages 45 to 64 and 65 and older had a higher long-term unemployment rate (45% and 42%, respectively) than younger workers in the fourth quarter of 2020 – 21% among workers ages 16 to 24 and 37% among workers ages 25 to 44.
It should be noted that college graduates and older workers have lower unemployment rates overall. In the fourth quarter of 2020, college graduates had an unemployment rate of 4%, compared with 10% for those with less than a high school diploma. Meanwhile, about 5% of workers ages 45 and older were unemployed, which is less than half the rate for workers ages 16 to 24 (11%). But when highly educated workers or older workers are out of work, they are unemployed for a longer period of time. This pattern could partially reflect difficulties highly trained or experienced workers have finding new jobs or switching career paths once they fall into unemployment.
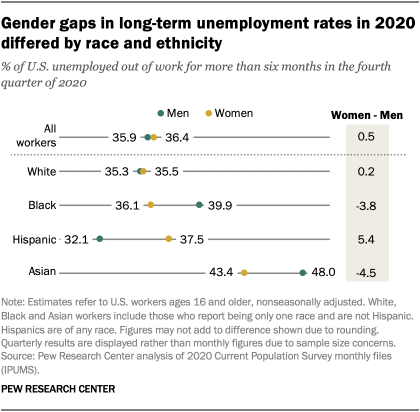
The long-term unemployment rate for women and men overall is about the same, but there are gender gaps among Black, Hispanic and Asian unemployed workers. In the fourth quarter of 2020, the long-term unemployment rate for unemployed Black men was 40%, compared with 36% for Black women. Likewise, the long-term unemployment rate was higher among unemployed Asian men (48%) than women (43%). Among unemployed Hispanic workers, however, women (38%) were more likely than men (32%) to be out of work for the long term. There was little difference in long-term unemployment among unemployed White women and men.
Counting discouraged workers among the unemployed raises the unemployment rate 0.6 percentage points for Black workers. The official unemployment rate (formally referred to as the U-3 rate) published monthly by the government includes only those workers who are actively looking for a job. Including discouraged workers, those who have not looked for work in recent weeks (the U-4 rate), yields another perspective on the state of unemployment in the economy.
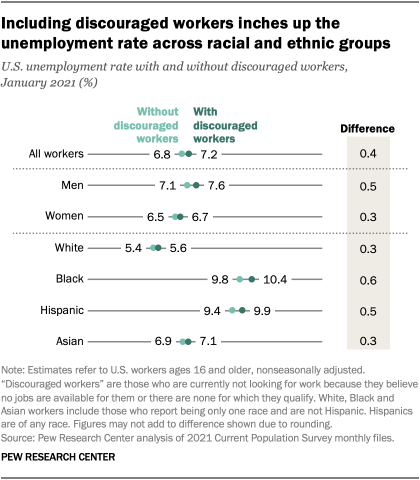
The U.S. unemployment rate including discouraged workers stood at 7.2% in January, compared with the official rate of 6.8%, which does not include discouraged workers (nonseasonally adjusted). For Black workers, this adjustment increases the unemployment rate from 9.8% to 10.4% (0.6 percentage points), pointing to a fairly high level of discouragement among them. The unemployment rate for Black men when discouraged workers are included is 0.9 points higher than the official rate for the group in January, 11.5% vs. 10.6%. This compares with an increase from 9.0% to 9.4% for Black women after discouraged workers are included. Hispanic workers’ unemployment rate increases from 9.4% to 9.9%. White and Asian American workers, meanwhile, see their unemployment rates higher by 0.3 points each; their respective rates become 5.6% and 7.1% in January with the inclusion of discouraged workers.
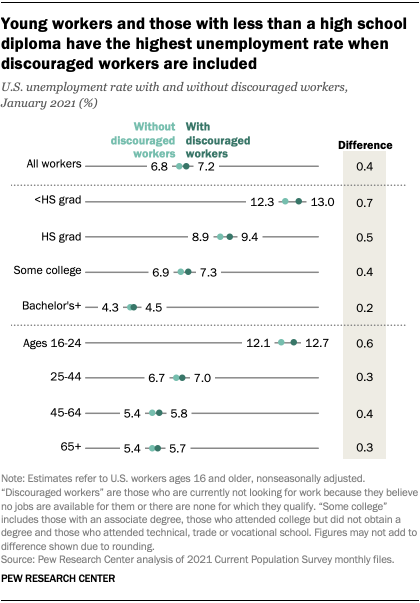
Workers without a high school diploma and young adults have an unemployment rate of about 13% when discouraged workers are included. The official unemployment rate for workers without a high school diploma stood at 12.3% in January 2021. With discouraged workers included, the rate rises to 13.0%. The adjusted unemployment rate for workers with a bachelor’s degree or more education inches up from 4.3% to 4.5% with discouraged workers. Looked at by age, the unemployment rate for workers ages 16 to 24 increases 0.6 percentage points when including discouraged workers, from 12.1% to 12.7%. The rates for workers ages 45 to 64 and those 65 and older increase about 0.3 points each.