
March 3 is “Super Tuesday” on this year’s Democratic presidential nominating calendar – the biggest single day in both number of elections and the total number of delegates at stake. All told, 1,357 delegates, or about 34% of all pledged delegates to this summer’s Democratic National Convention, will be chosen in 14 state primaries and one territorial caucus (American Samoa). And a weeklong “global primary” for overseas Democratic voters also starts March 3, with 13 delegates at stake.
While clearly significant, this year’s Super Tuesday is by no means the “super-est” – or the earliest – one the Democratic Party has ever had. By both contests held and delegates awarded, the party’s biggest Super Tuesday was Feb. 5, 2008 – 1,688 delegates, more than 47% of the pledged total, were chosen in 24 primaries and caucuses, a haul so impressive that it was dubbed “Super-Duper Tuesday” and “Tsunami Tuesday.” (This post focuses on the Democrats because Republicans aren’t having a competitive nomination contest this year.)
How we did this
The data used in this post was compiled from several sources. For the 2004, 2008, 2016 and 2020 primary seasons, we obtained primary and caucus dates from the Federal Election Commission and cross-checked them with other sources, mainly the University of Virginia’s Center for Politics and The Green Papers, an election data blog. For the 1988, 1992 and 2000 primary seasons, we obtained primary and caucus dates from the latter two sources. When state delegate-selection processes involved several stages, we used the date of the Democratic Party’s designated “first determining step” in our analysis. For events that lasted over several days, we used the first date in our analysis.
For the number of delegates at stake in each primary or caucus, The Green Papers was the source for the 2000-2020 primary seasons. The 1988 and 1992 seasons were compiled from a variety of sources, including a Congressional Research Service report; “National Party Conventions 1831-2004,” a book published in 2005 by CQ Press; and contemporaneous coverage of the nomination contests from The New York Times’ online archive. In some cases those sources gave differing delegate counts, primarily because they either used outdated figures or combined pledged delegates (those chosen by voters) with unpledged, automatic “superdelegates.” When we could not reconcile the varying figures, we went with the pledged-delegate figures published in the Times.
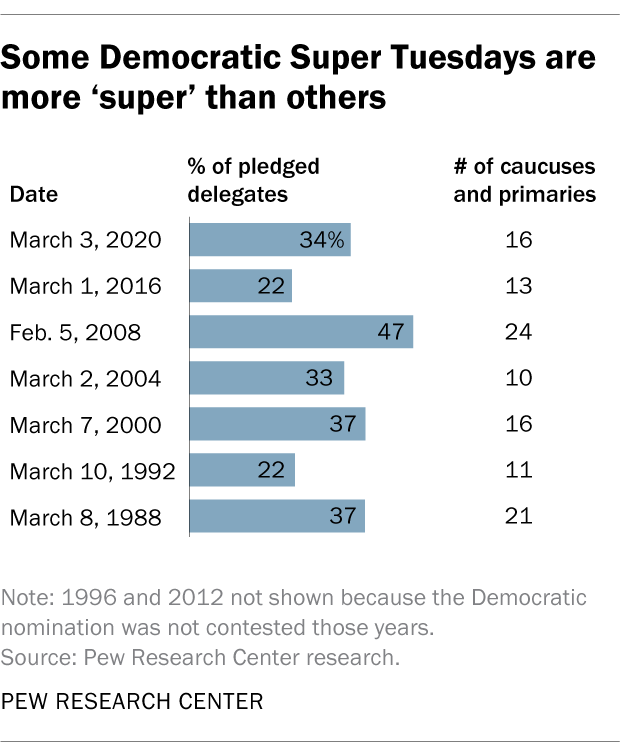
Due in large part to Super-Duper Tuesday’s huge delegate bonanza, 2008 was also perhaps the most front-loaded Democratic nomination schedule since the modern, primary-dominated nomination era began in 1972. In 2008, 70% of delegates had been chosen by Valentine’s Day, and 83% by the first week of March. Nonetheless, the race between Barack Obama and Hillary Clinton remained so close that it continued all the way to the end of primary season in early June.
Since then, the front-loading of the nominating calendar has abated somewhat. After Super Tuesday in 2016, only about a quarter of pledged delegates had been selected, and the two-thirds threshold was not crossed until late April. Even after this year’s Super Tuesday contests, 62% of pledged delegates will remain to be chosen; that two-thirds point won’t be reached until early April.
The phrase “Super Tuesday” dates back to at least the 1976 primary season. That year, it referred to the last set of major primaries in June, when three big states – California, New Jersey and Ohio – all voted and neither the Democratic nor Republican nomination had been sewn up. In 1984, there were three “Super Tuesdays,” each with sizable but not overwhelming delegate hauls at stake.
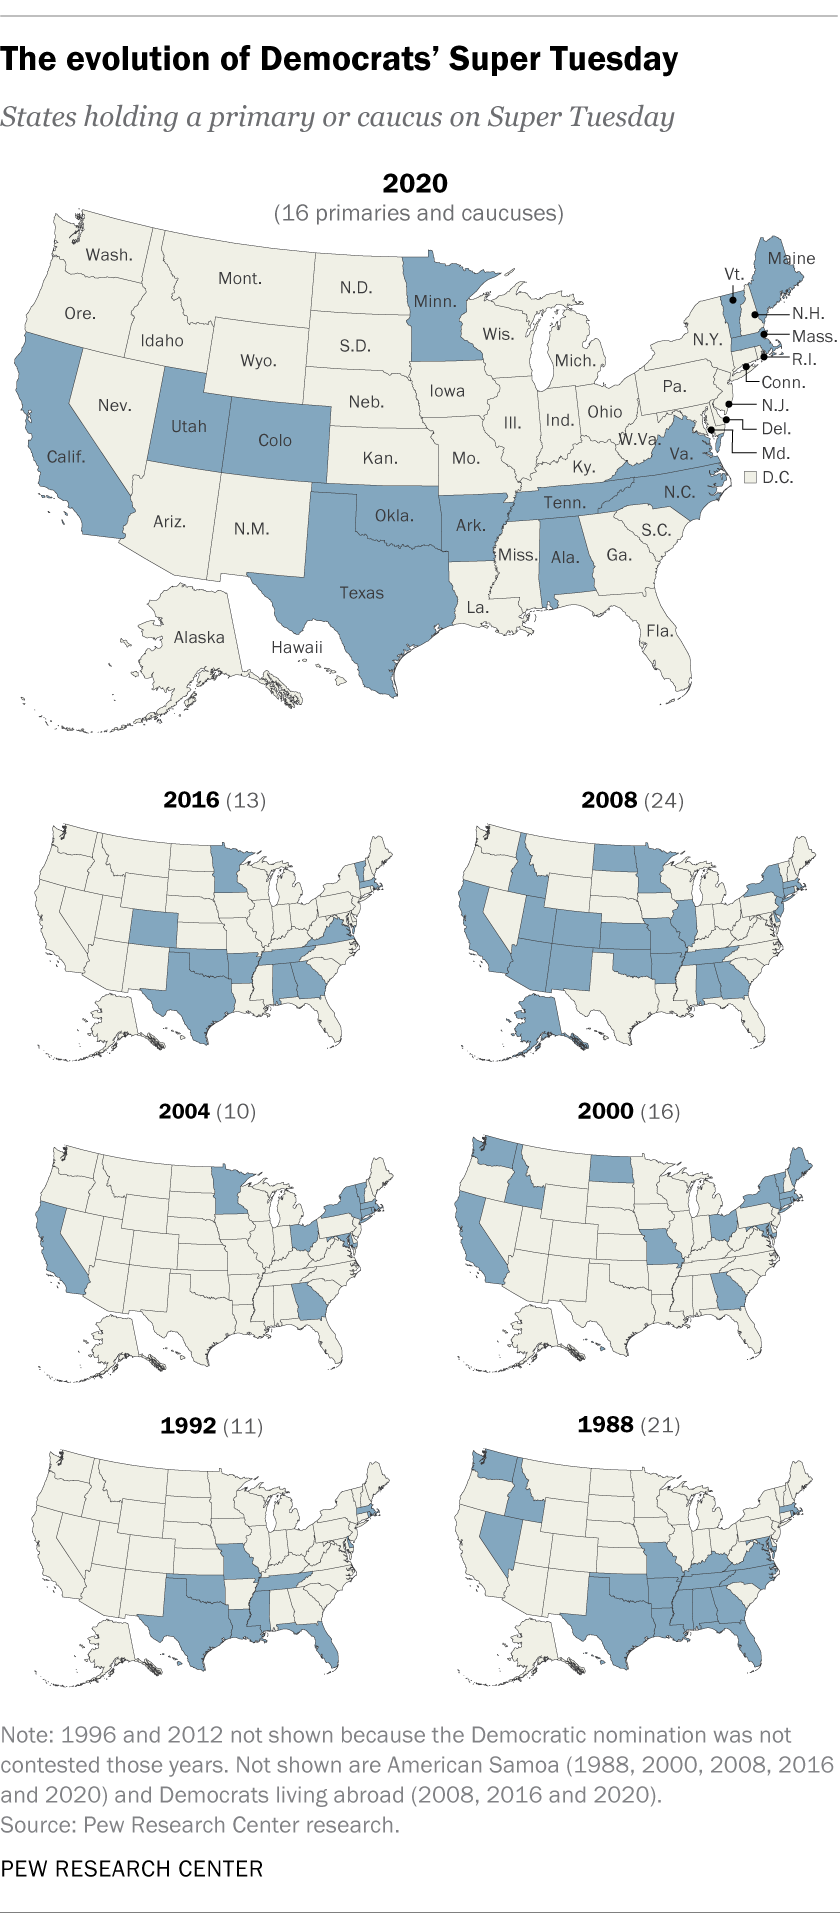
The first Super Tuesday in the current sense, though, came in 1988. After Walter Mondale’s landslide loss to President Ronald Reagan in 1984, Democratic leaders in several Southern states reasoned that if their states held their nominating contests on the same day, relatively early in the cycle, they could boost the chances that someone from the region – or at least someone perceived as being moderate enough to do well there in November – would get the nomination. That year, 13 Southern states signed on to the plan, as did seven other states (and American Samoa). Super Tuesday was born, more or less as we know it today. (Republicans held their own contests in 17 states that same day, further cementing the day’s status in the political firmament.)
Since then, the constellation of Super Tuesday states has varied, but the day retains a certain Southern flavor to this day. Of the 14 states voting next week, half are in the South.
Over time, both the number of Super Tuesday contests and the share of delegates at stake have fluctuated considerably. On Super Tuesday 2004, for instance, only 10 states held primaries or caucuses, but because some of them (California, New York, Ohio) had large convention delegations, about a third of pledged delegates were chosen that day. In 2016, by contrast, the 13 Super Tuesday contests accounted for 878 delegates, or just under 22% of total pledged – the lowest Super Tuesday delegate share ever. Two later primary dates, March 15 and June 7, were also significant, with almost 700 delegates at stake on each day.
Political observers have noted that, while the original architects of Super Tuesday were largely white, moderate Southerners, demographics and partisanship have evolved such that the day now gives racial and ethnic minorities a greater say in the nominating process. Among the estimated 89 million eligible voters in this year’s 14 Super Tuesday states, 18% are Hispanic, 11% are black and 6% are Asian, according to Pew Research Center estimates. In some states, the minority shares are far higher: In California, for instance, an estimated 30% of eligible voters are Hispanic and 14% are Asian; blacks make up an estimated 26% of eligible voters in Alabama, 22% in North Carolina and 19% in Virginia.
