
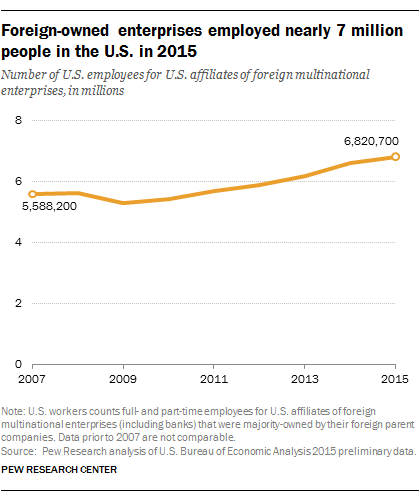
Foreign-owned companies employed 6.8 million workers in the United States in 2015, up 22% from 2007, according to preliminary data from the U.S. Bureau of Economic Analysis. The increase is notably larger than overall U.S. private employment growth, which was 3.6% over the same span.
Among foreign enterprises, British-owned companies employed the highest number of U.S. workers in 2015 (around 1.1 million), followed by companies with majority ownership in Japan (around 856,000) and France, Germany and Canada (each over 600,000). These five countries alone accounted for a majority (58%) of U.S. employment by foreign-owned enterprises in 2015 and have made up the top five since at least 2007, the earliest year for which comparable data are available.
Overall, foreign-owned companies accounted for 5.5% of all U.S. private sector employment in 2015, up from 4.7% in 2007. This analysis counts full- and part-time employees of foreign multinational enterprises’ U.S. affiliates (such as corporate branches) that were majority-owned by their foreign parents in 2015, the most recent year available. The BEA provides country-level data for 41 countries and territories, as well as broader regional and global totals.
For British-owned enterprises, transportation and hospitality and food services were among the top-employing industries in the U.S. Jobs in manufacturing (especially transportation) and wholesale trade stood out for Japan.
While companies majority-owned in the UK and Japan have led the pack for foreign direct investment, U.S. employment by Chinese-owned companies has grown exponentially since 2007, showing by far the largest percentage increase in employment. Chinese enterprises employed nearly 44,000 U.S. workers in 2015, more than 30 times greater than in 2007. By comparison, New Zealand (second fastest for U.S. employment growth) employed nearly five times as many U.S. workers in 2015 as in 2007 – paling in comparison with China.
Although Canada is consistently a top employer among U.S. affiliates, employment by the U.S.’s southern neighbor is increasing. Mexican-owned companies had nearly 80,000 U.S. workers on their payrolls in 2015, an 82% increase over 2007.
What foreign enterprises pay their U.S. workers
As the country with the most U.S.-affiliate employees, the UK also paid the most in total compensation ($84.9 billion) in 2015. Japan, the second-highest employer of U.S. affiliates, followed at $72.2 billion.
Foreign-owned companies overall paid $539.1 billion in total compensation to U.S. workers in 2015 – around $79,000 per employee. This figure includes all income received for work, including employer spending for employee benefit plans. Compensation by foreign companies was somewhat higher than the average among all U.S. private industry employers in 2015, which was around $63,600 per employee, according to Bureau of Economic Analysis data.
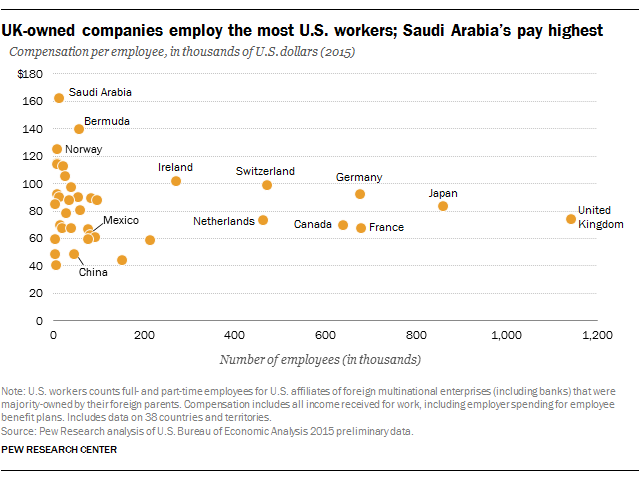
Saudi Arabian companies had the highest compensation per employee at around $163,000, more than double the figure for all foreign-owned companies. However, Saudi Arabian companies have consistently employed far fewer U.S. workers than other U.S. affiliates – British companies, for example, employed over 100 times as many in 2015.
Seven other countries’ U.S. affiliates had an average compensation per worker of more than $100,000: Bermuda, Norway, Venezuela, South Africa, Israel, Finland and Ireland; Switzerland’s enterprises paid just under six figures per employee on average. Of these countries, only Irish- and Swiss-owned companies employed more than 100,000 workers.
Despite the recent surge in U.S. employment by companies majority-owned in China, compensation per worker by Chinese enterprises trended downward from 2007 and ranked near the bottom of countries and territories analyzed for 2015 at around $49,000 per employee.
Some states have more foreign direct investment than others
U.S. affiliates of foreign-owned companies employ people in all 50 states and in U.S. territories. In 2015, the states with the largest shares of total private industry employment by foreign-owned companies were New Jersey (8.1%), South Carolina (8.0%) and New Hampshire (7.7%), followed by Kentucky, Indiana, Hawaii, Connecticut and Delaware (each more than 7%). The states with the largest populations in general also had the most employees who worked for foreign-owned companies: California, Texas, New York, Florida and Illinois. California led, with 715,800 such workers.
Rising contribution to U.S. GDP
Foreign-owned companies contributed $894.5 billion to the U.S. gross domestic product in 2015, a 16% increase from 2007 and 6.4% of the total contribution to the GDP by U.S.-based private industry during this span. While 2007 is the earliest comparable year for these data, it also marks the start of the Great Recession, which appears to have had a larger impact on U.S. affiliates of foreign enterprises than on U.S. private businesses.
During the 2007-2009 recession, the contribution to the GDP by U.S. affiliates declined at an average rate of 6.7%, compared with a 1.6% average decline for U.S. private businesses. After the recession, GDP contributions rose faster for U.S. affiliates than for U.S. private businesses. Between 2009 and 2014, U.S. affiliate contributions to the GDP increased 8.3% on average, nearly twice the rate of U.S. private businesses.
