
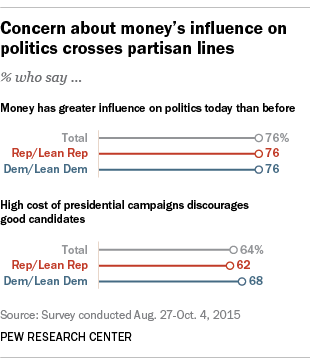
Americans of different political persuasions may not agree on much, but one thing they do agree on is that money has a greater – and mostly negative – influence on politics than ever before. Among liberals and conservatives, Republicans and Democrats, large majorities favor limits on campaign spending and say the high cost of campaigning discourages many good candidates from running for president.
While perceptions of influence are subjective, there’s clearly more money in the U.S. political system now than at any time since the campaign finance reforms of the 1970s, according to a new Pew Research Center data analysis of contributions and spending. That’s the case whether you look at presidential, House or Senate elections.
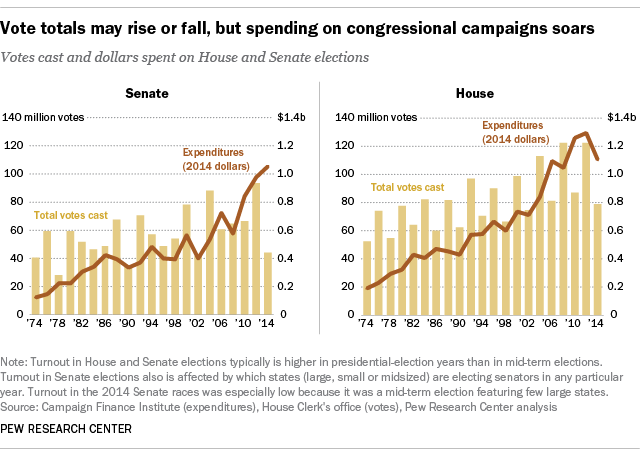
Last year’s midterm Senate election was the costliest ever – or at least since 1974, when modern disclosure rules kicked in. The 2014 election featured several competitive races, the outcomes of which would determine control of the Senate; Democrats and Republicans fought – and spent – fiercely. According to our analysis of Campaign Finance Institute data, nearly $1.1 billion was spent on 2014’s Senate races by candidates, parties and outside groups, 25% more than in the previous off-year cycle of 2010. The biggest increase was in non-party independent expenditures, which soared from $105.6 million (inflation-adjusted) to $387.3 million.
But despite all that money and attention, voter turnout in last year’s Senate elections didn’t increase; in fact, it was the lowest since 1990. We calculated turnout using estimates of the voting-eligible population (all citizens of voting age, at home and abroad, excepting ineligible felons) made by University of Florida political scientist Michael McDonald. Only about 44 million people voted for Senate in 2014, according to tabulations published by the House Clerk’s office – 38% of the voting-eligible population in those states with Senate elections.
Across the Rotunda, $1.1 billion was spent last cycle on House elections by candidates, parties and outside groups, according to our analysis of the CFI data. That was somewhat less than in the 2010 and 2012 election cycles (after adjusting for inflation), but still a substantial amount, given that only a few dozen House races were considered competitive going in. Nearly 79 million people voted in House races last year, or 35% of the estimated voting-eligible population – the lowest turnout level since 1998.
[chart id=”275523″]
The increase in campaign money spent, combined with the drop in actual turnout, resulted in a record $24 spent on each Senate vote cast in 2014, compared with about half that amount – $12.74 – spent in the previous off-year cycle of 2010, our analysis found. Spending per House vote cast wasn’t quite a record in 2014: $14.05 per vote, a similar level to the previous two midterms. (Per-vote spending on House races tends to drop significantly in presidential-election years.)
In presidential races, we examined in detail Federal Election Commission data on contributions and expenditures from 2000 to the present. Total receipts, the total amount of reported cash that flows into a campaign from outside sources, peaked in the 2008 election cycle, at more than $1.8 billion ($2.03 billion in inflation-adjusted dollars) – nearly triple the receipts of such committees in 2000.
In the 2012 cycle, only the Republicans had an active primary season, but that didn’t stop the flow of political money: Official campaigns still had total receipts of nearly $1.4 billion ($1.44 billion in constant dollars), according to our analysis.
It’s still early in the 2016 presidential cycle, with the first-in-the-nation Iowa caucuses two months away. But the two dozen or so official presidential campaign committees collectively have raised more than $278 million, according to our analysis. Among Democrats, Hillary Clinton ($77.5 million) is leading Bernie Sanders ($41.5 million) and Martin O’Malley ($3.3 million), while Ben Carson ($31.4 million), Ted Cruz ($26.6 million) and Jeb Bush ($24.8 million) are pacing the crowded GOP field.
But the official campaign structures aren’t the whole story. Independent expenditures, so called because they are supposed to be uncoordinated with the official campaigns, have become increasingly prominent in recent years. (Note: None of our analyses include so-called 527 organizations, tax-exempt groups that engage in political activities and report to the IRS rather than the Federal Election Commission. Federal contribution and spending rules don’t apply to 527s, so long as they don’t expressly advocate for a candidate’s election or defeat. While prominent for several years in the mid-2000s, their role has largely been taken over by “super PACs,” discussed below.)
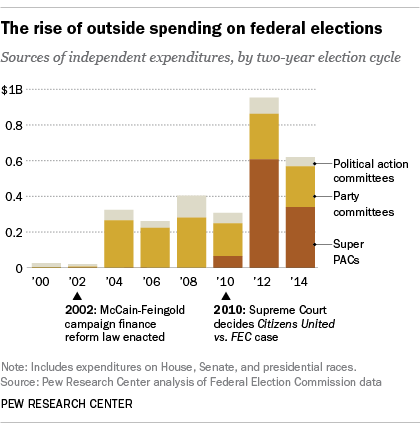
Independent expenditures can expressly advocate for a candidate’s election or defeat. They can be made both by political party committees and by outside groups so long as they are not made in direct coordination with a candidate. These include so-called super PACs that became possible after two 2010 court rulings, Citizens United v. FEC and SpeechNow.org v. FEC. After the 2002 McCain-Feingold law banned political parties from raising or spending “soft money” on elections, the parties greatly increased their independent expenditures – to $265 million in 2004, from $5.7 million in 2002.
Super PACS can raise unlimited funds from individuals, corporations and unions, and spend the money to directly advocate for or against candidates, so long as their activities aren’t coordinated with an official campaign or party. Since they became legal, super PACs have rapidly become a major force in U.S. politics. Collectively, according to our analysis, they made independent expenditures of $65 million in 2010, $608 million in the 2012 presidential election cycle and $339 million in the 2014 mid-term election cycle.
So far in the current cycle, according to the Center for Responsive Politics, 1,260 super PACs have raised a total of $313.5 million and spent $73.2 million. Most of the major presidential candidates have at least one super PAC supporting them; the one backing Jeb Bush, Right to Rise USA, had nearly $98 million on hand as of June 30, its most recent reporting date.

