In the shifting journalism ecosystem, proliferating nonprofit outlets are emerging as an increasingly important source of news and information. Over the past few years, the number of nonprofit news outlets has grown dramatically, yielding new collaborations and some closures, but also a few Pulitzer Prizes.

One of the major nonprofit news funders, the John S. and James L. Knight Foundation, released a report Tuesday that deeply examines the vital signs of 18 well-established nonprofit news outlets, many of which have received Knight funding. The group includes some of the bigger names, such as ProPublica and Texas Tribune, but also some smaller ones, such as Oakland Local and VTDigger. The report’s findings include some positive trends, with 14 of the 18 outlets showing a surplus in 2012. But some challenges remain, particularly when it comes to the level of investment these nonprofits are making in technology and business development.
Below are five key data points from the report that provide a sense of how the nonprofit news field is faring. (Pew Research’s Journalism project has also conducted related research on nonprofit news and recently conducted a roundtable discussion on the subject with Knight.)
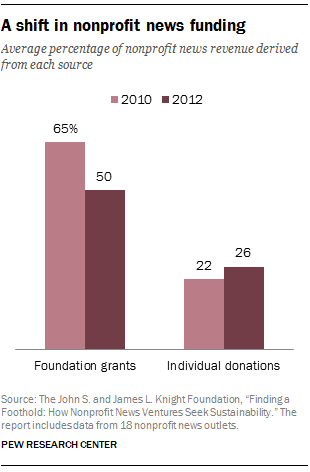
50%: The percentage of nonprofit revenue coming from foundation grants in 2012. That still amounts to the biggest source of funding for the majority of the nonprofits in the report. But it also reflects an important move toward diversifying revenue streams. As recently as 2010, foundation money accounted for 65% of the revenue for these 18 nonprofits. At the same time, the Knight report shows that these nonprofits, on average, are generating a higher percentage of revenue from individual donations and other sources, such as events and sponsorships.
8,000: The approximate number of individual donors that, in 2012, supported the 18 nonprofits studied by Knight. That’s roughly double the number of donors counted in 2010. While many of these donors are contributing large sums, several of the organizations benefit from the support of many small donors. At MinnPost, for example, 30% of all individual donations were in amounts less than $1,000, and they serve as a measure of community engagement.
54%: The combined increase in the budgets of the 18 nonprofits studied between 2010 and 2012. While some of the increase is attributable to large one-time events, such as the acquisition of Bay Citizen by the Center for Investigative Reporting, the growth signals expanded organizational capacity. But what are they spending their money on? The Knight report finds that investment in editorial operations accounts for much of these budgets, while investment in technology or business development accounts for considerably less. That dovetails with the recent Pew Research report in which nearly two-thirds (62%) of the 93 nonprofit organizations surveyed identified “finding time to focus on the business side” as a major challenge.
2 minutes: The approximate average time spent per visit on the nonprofit news websites. For more than half of the outlets studied, it is less than the average time spent two years earlier. While audience engagement measures like these are cause for concern, there is also widespread debate within the nonprofit news community about the best ways to measure audience engagement, and an acknowledgement that the standard metrics are inadequate. Those broader questions about assessing impact may well be the next big nut to crack for nonprofit journalism.
181: The number of events staged in 2012 by the 18 profiled nonprofit news outlets. These gatherings—which range from large events like Voice of San Diego’s Politifest to smaller meetups—represent a potentially significant source of income and an opportunity for brand-building for nonprofits. All told, these drew some 20,000 people. And so far in 2013, the Texas Tribune is on track to generate more than $1 million on events and conferences.