
Latinos’ views of same-sex marriage have changed dramatically in recent years. In 2012 for the first time, more Latinos said they favored same-sex marriage than opposed it (52% versus 34%) according to a Pew Hispanic Center survey. This is a reversal from six years earlier, when one-third (31%) of Latinos favored same-sex marriage and more than half (56%) opposed it. This shift in views tracks with that of the general public, whose opinions on same-sex marriage have also changed in recent years.
But even though more Hispanics now favor same-sex marriage than oppose it, not all Hispanic groups hold the same view.
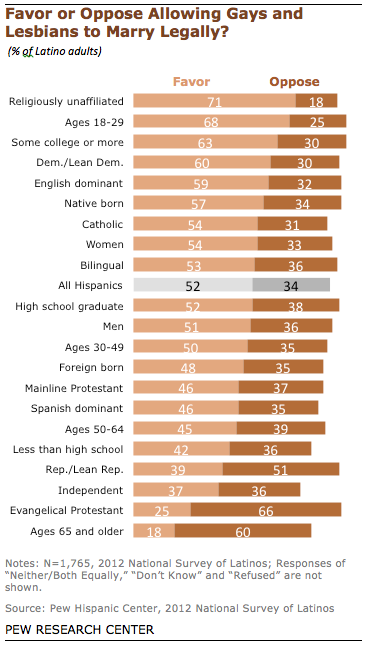
According to the National Survey of Latinos, support for allowing gays and lesbians to marry legally is highest among Latino adults with no religious affiliation (71%), Latinos ages 18 to 29 (68%), Latinos who identify with or lean toward the Democratic Party (60%) and Latinos with some college education or more (63%).
By contrast, the strongest opposition to same-sex marriage comes from Evangelical Hispanics, 66% of whom oppose allowing gays and lesbians to marry legally. Additionally, 60% of Hispanics ages 65 and older and 51% of Hispanics who identify with or lean toward the Republican Party oppose legalizing same-sex marriage.
It’s worth noting that all of these trends by age, political party and religious affiliation among Latinos track the general public’s trend as well.
Since 2006, support for same-sex marriage has grown by 20 percentage points or more for nearly all major demographic subgroups of Latinos, reflecting changes in Latinos’ views toward gays and lesbians.
However, for some subgroups, views have changed little. Among Latinos ages 65 and older, in 2006, just 16% said they were in favor of same-sex marriage. By 2012, only 18% said they were in favor of it. Similarly, among Latinos who identify as politically Independent, 35% were in favor in 2006 compared with 37% in 2012.
3:06 p.m.: This post has been updated. Percentages have been corrected for each Latino religious subgroup and also for each Latino political party subgroup.
