This Pew Research Center study calculates Religious Diversity Index (RDI) scores for countries, territories and world regions based on the distribution of seven religious categories: Christians, Muslims, Hindus, Buddhists, Jews, adherents of all other religions (an umbrella category) and people with no religious affiliation.
The underlying estimates of the size of religious populations were previously published in Pew Research Center’s 2025 report, “How the Global Religious Landscape Changed From 2010 to 2020.” The estimates covered 201 countries and territories, each of which had at least 100,000 people in 2010 or 2020. Together, these 201 countries and territories accounted for 99.98% of the global population in 2020.
We limited our analysis to seven religious categories to enable comparisons across the world, including in many countries and territories where reliable data is not available on smaller religious subgroups, such as Protestant denominations. If we were to count various denominations, branches, sects or movements within each religion separately, the diversity scores would be different.
For example, the United States would have a higher diversity score if we treated Catholics, Orthodox Christians and numerous Protestant denominations as separate religious groups instead of as a single “Christians” category. Similarly, other countries would have higher scores if we counted subgroups of Muslims, Jews, Hindus and Buddhists separately, or if we divided the “religiously unaffiliated” category into subgroups such as atheists and agnostics.
Although there is internal diversity within each of the seven religious categories used in this analysis, they are generally recognized as distinct from one another.
Calculating Religious Diversity Index scores
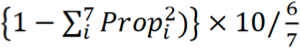
The Religious Diversity Index (RDI) is a modified version of the Herfindahl-Hirschman Index and is calculated using this formula:
The calculation involves three steps, as illustrated in the accompanying table.
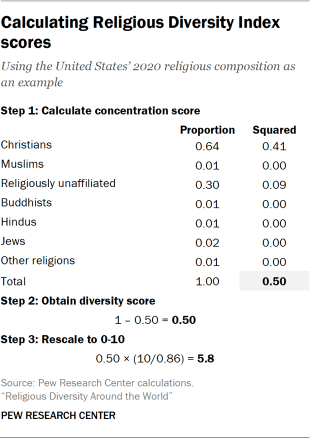
- First, the proportions of the seven religious categories analyzed in this study are squared and then summed to obtain a score representing how concentrated they are. In this first step, a country made up of a single religious group would get a score of 1, while a country where the population is evenly distributed among seven groups would get a score of 0.14.6
- Second, we subtract the first-step score from 1 so that higher scores reflect higher religious diversity.
- Third, the second-step score is further adjusted to put the final Religious Diversity Index on a scale of 0 to 10, which involves inflating the second-step score by a factor of 11.6 (=10/0.86).
Two factors determine a country’s religious diversity score: the extent to which its population falls into a single religious group, and the degree to which the remaining population is dispersed across other religious categories. When a single religious group constitutes a higher proportion of the population, the country receives a lower RDI score.
Meanwhile, among countries where the largest group comprises the same share of the population, places in which the remaining population is distributed more evenly across groups score higher on the RDI. For example, in a country in which 70% of the population belongs to a single religious group, the index score would be 4.9 if the remaining 30% were concentrated in just one category. However, the score would rise to around 5.7 if the remainder were spread evenly across five or six different groups.
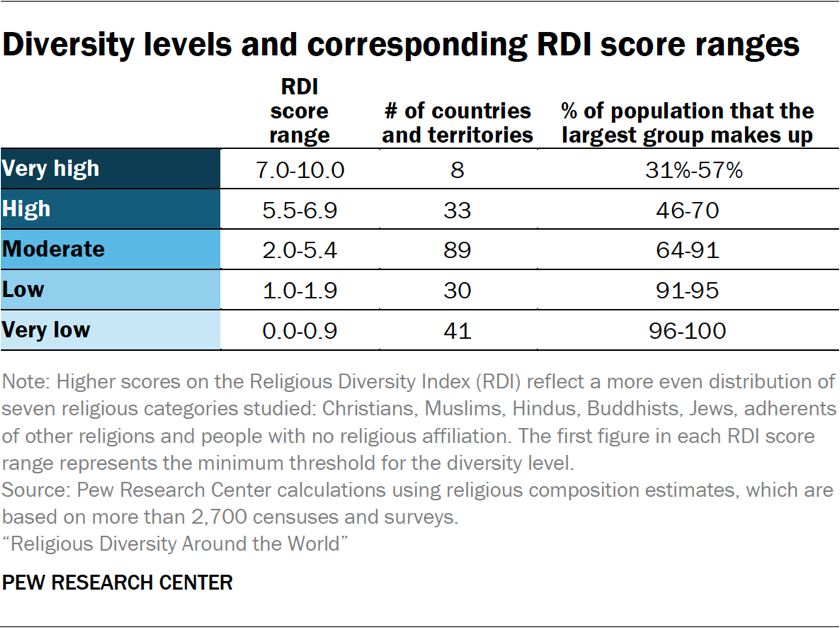
The resulting score corresponds to an assigned level of religious diversity: very high, high, moderate, low or very low.
This classification reflects the extent to which a population is concentrated in a single religious group. For instance, countries and territories in the “very high” category have a relatively even distribution of the seven groups studied. In these places, no religious category makes up more than 57% of the population. By contrast, in places that are in the “very low” category, the largest religious category accounts for 96% or more of the population.
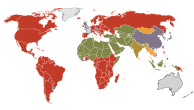
Refer to Appendix B for a detailed table showing RDI scores, religious diversity classifications, and religious composition data for 201 countries and territories. The table also includes diversity calculations for world regions.
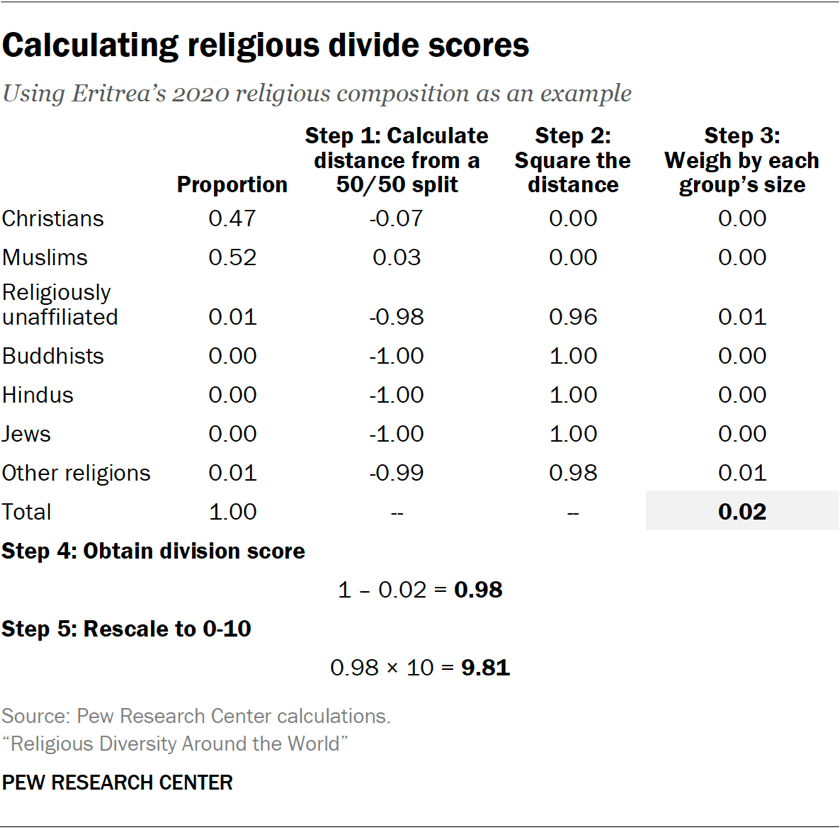
Calculating religious divide scores
To measure the extent to which countries and territories are evenly split between just two religious categories, we relied on the Reynal-Querol index, calculated using the distance of the distribution of the groups from a 50/50 distribution. A country where virtually everyone belongs to a single religious group gets a score of 0, while a country with two equally sized groups receives a score of 10.
The calculation follows the formula:
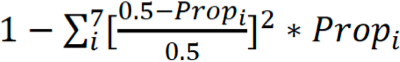
Propi represents each religious category’s share in the population. The formula gives more weight to bigger groups while adjusting for the size of the rest of the population. As with the RDI scores, we rescale the final values to range from 0 to 10.
Appendix C contains religious divide scores and religious composition estimates (2010-2020) for all countries, territories and world regions included in this analysis.
How our diversity measures differ from what we published in 2014
The Religious Diversity Index scores in this report shouldn’t be directly compared with those we published in the 2014 “Global Religious Diversity” report. While we use the same methodology – a modified version of the Herfindahl-Hirschman Index – to calculate Religious Diversity Index scores, the underlying religious composition numbers have been updated.
As described in our 2025 report, “How the Global Religious Landscape Changed From 2010 to 2020,” we have recently adjusted our data sources and methods for 2010 to make them more methodologically comparable with our 2020 estimates. In most cases, the differences between our old and new 2010 figures are modest. In China, however, the revisions resulted in a considerable change to the country’s religious composition estimates and, consequently, its level of religious diversity.
Additionally, our revised composition estimates no longer include separate figures for adherents of folk religions. Instead, people who identify with folk religions are now included in the “other religions” category. As a result, the Religious Diversity Index scores in the current study reflect the distribution of seven religious categories rather than eight, as in the 2014 study.
Refer to Appendix B for RDI scores and religious composition estimates (2010-2020) for all countries, territories and world regions included in this analysis. The 2010 estimates in the appendices reflect our updated methodology.