Pew Research Center conducted this survey to explore Americans’ attitudes toward a variety of religious groups as part of a broader effort to study tolerance, diversity and pluralism in American society. For this report, we surveyed 10,588 U.S. adults from Sept. 13-18, 2022. All respondents to the survey are part of Pew Research Center’s American Trends Panel (ATP), an online survey panel that is recruited through national random sampling of residential addresses. This way nearly all U.S. adults have a chance of selection. The survey is weighted to be representative of the U.S. adult population by gender, race, ethnicity, partisan affiliation, education, religious affiliation and other categories. For more, read the ATP’s methodology and the methodology for this report.
Read the full questions used in this report.
Far more Americans express favorable than unfavorable views of Jews, mainline Protestants and Catholics, according to a recent Pew Research Center survey that measures U.S. adults’ broad sentiments toward several religious groups.
At the other end of the spectrum, more Americans express negative than positive attitudes toward atheists, Muslims and Mormons (members of the Church of Jesus Christ of Latter-day Saints).
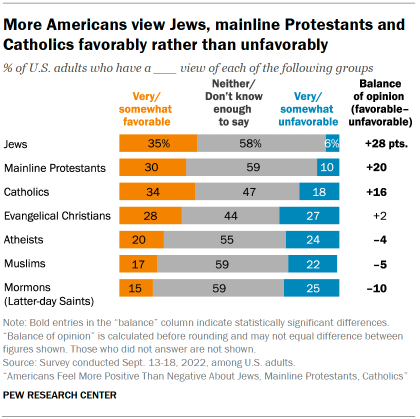
Some survey respondents may find it strange or difficult to be asked to rate an entire group of people. Indeed, most Americans give a neutral response – or choose not to answer the question – when asked about some religious groups. For example, about six-in-ten U.S. adults (59%) say they hold “neither favorable nor unfavorable” views of Muslims or “don’t know enough to say,” while 17% express very or somewhat favorable views of Muslims and 22% express very or somewhat unfavorable views of the group.
The patterns are affected in part by the size of the groups asked about, since people tend to rate their own religious group positively. This means that the largest groups – such as Catholics and evangelical Christians – get a lot of favorable ratings just from their own members. One way to adjust for this is to examine how people rate all religious groups except their own.
Looking at the data this way, it is clear that non-Catholic Americans have a net positive view of Catholics. But there is a big difference between the way that evangelical Christians are rated by the whole public (including roughly one-quarter of U.S. adults who describe themselves as born-again or evangelical Protestants) and the way they are rated by people who are not evangelicals.
Overall, similar shares of the whole public say they view evangelical Christians favorably (28%) and unfavorably (27%). But among Americans who are not themselves born-again or evangelical Protestants, the balance of opinion is much more negative (32% unfavorable vs. 18% favorable). Some of this sentiment is tied up with politics: Democrats who are not born-again or evangelical Protestants are far more likely than non-evangelical Republicans to view evangelicals negatively (47% vs. 14%, respectively).
On the whole, 35% of Americans express very or somewhat favorable attitudes toward Jews, while 6% express unfavorable attitudes. (Jews make up such a small portion of the U.S. population – about 2% – that excluding their own views makes little difference in overall public opinion toward Jews.) The positive public attitude toward Jews may not tell the whole story, however: A 2020 survey of Jewish Americans found perceptions of rising antisemitism in the United States, and other organizations have reported an increase in antisemitic incidents.
Americans overall also express more favorable than unfavorable attitudes toward mainline Protestants (30% favorable vs. 10% unfavorable) and Catholics (34% favorable vs. 18% unfavorable).
On the other hand, the balance of opinion is negative in the case of Mormons. A quarter of Americans say they hold very or somewhat unfavorable views of Mormons, while 15% express favorable opinions. Views toward atheists and Muslims also are slightly negative, on balance, with more reporting unfavorable than favorable opinions of each group.
More than half of Americans say they either feel neutral about, or do not know enough to rate, mainline Protestants (59%), Muslims (59%), Mormons (59%), Jews (58%) and atheists (55%). Smaller shares – although still pluralities – do not register favorable or unfavorable opinions of Catholics (47%) and evangelical Christians (44%).
These are among the key findings of a new Pew Research Center analysis based on a survey conducted Sept. 13-18, 2022. This is not the first time the Center has measured views of religious groups. Previous studies in 2014, 2017 and 2019 used a “feeling thermometer” to rate feelings on a scale from 0 to 100. The new survey uses a different approach, asking respondents whether their views toward various religious groups are very favorable, somewhat favorable, neither favorable nor unfavorable, somewhat unfavorable, or very unfavorable; respondents also had the option of saying they “don’t know enough to say.” Although the results of the new survey are not directly comparable with the previous studies, the broad patterns are similar. Both approaches show relatively warm (i.e., positive) public attitudes toward Jews, Catholics and mainline Protestants, and cooler (i.e., more negative) opinions toward Mormons, Muslims and atheists.
The remainder of this report looks at the results of the new study in more detail.
Americans tend to rate their own religious group positively
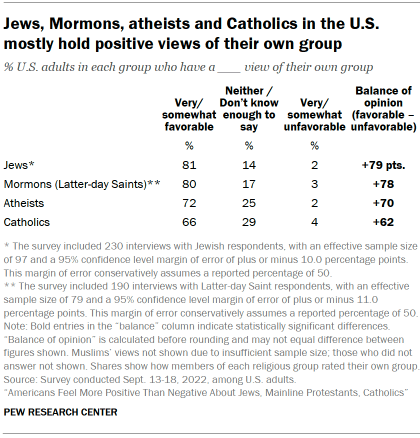
The groups examined all rate themselves favorably, on balance. For instance, about eight-in-ten U.S. Jews (81%) rate Jews very or somewhat favorably, versus just 2% who express unfavorable views. Similarly, 80% of members of the Church of Jesus Christ of Latter-day Saints view Mormons favorably, while just 3% hold an unfavorable opinion – a difference of 78 percentage points. Majorities of atheists (72%) and Catholics (66%) also hold favorable views of their own religious groups.
The picture is a little less clear with respect to views of “evangelical Christians” and “mainline Protestants.” Most of the groups asked about in the survey correspond directly to the way respondents describe themselves in a question about their religious identity. Specifically, respondents are asked “What is your present religion, if any?” and the options they can choose from include “Catholic,” “Mormon,” “Jewish,” “Muslim,” and “atheist,” among others. Thus, the survey provides a direct estimate of how members of these groups rate their own group.
However, there is no single survey question in which respondents can identify themselves as “evangelical Christians” or as “mainline Protestants.” Rather, in response to the question about their present religion, respondents have the option of choosing “Protestant.” They are then asked a yes-no question: “Would you describe yourself as a born-again or evangelical Christian?” This question can help provide a rough (but far from perfect) proxy for how these groups view themselves.
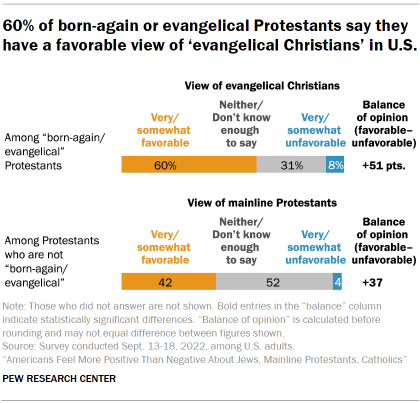
Most Protestants who describe themselves as “born-again or evangelical Christians” (60%) say they have a favorable view of evangelical Christians. Among Protestants who are not born-again or evangelical, 42% express a favorable view of mainline Protestants. This group’s rating of mainline Protestants is less favorable than the ratings other religious groups assign to themselves. Still, Protestants who are not born-again or evangelical are far more positive than negative: Just 4% rate mainline Protestants unfavorably.
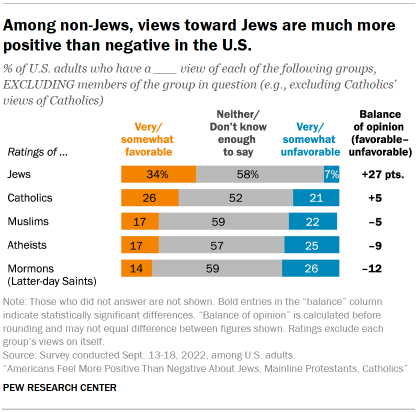
When members of religious groups are excluded from rating themselves, favorability ratings for some groups are lower. For instance, about a quarter of non-Catholics (26%) hold positive views of Catholics, while 34% of U.S. adults overall (including Catholics) report very or somewhat favorable attitudes toward Catholics.
Still, non-Catholics are more likely to have a favorable (26%) than unfavorable (21%) view of Catholics. The same is true for Jews, but with an even bigger gap: About one-third of non-Jews (34%) express favorable views toward Jews, compared with just 7% of non-Jews who voice unfavorable views.
In contrast, Mormons, atheists and Muslims are viewed unfavorably, on balance, by Americans both overall and outside of each of these groups. For example, about a quarter of U.S. adults who are not members of the Church of Jesus Christ of Latter-day Saints (26%) report negative views of Mormons, compared with 14% who hold positive views.
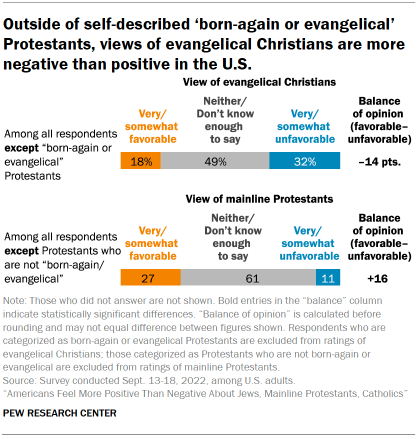
Among respondents who are not born-again or evangelical Protestants, views of evangelical Christians are far more negative than positive. About a third in this group (32%) rate evangelicals negatively, compared with 18% who rate them positively, making evangelical Christians among the most negatively rated religious groups by people who are not members of the group.
By contrast, mainline Protestants are viewed far more positively than negatively by people who do not fit the rough approximation of mainline Protestant identity (i.e., all respondents except those who identify as Protestant but do not select the “born-again/evangelical” label when asked in a follow-up survey question).
U.S. adults who know someone from a religious group are more likely to report favorable views of that group
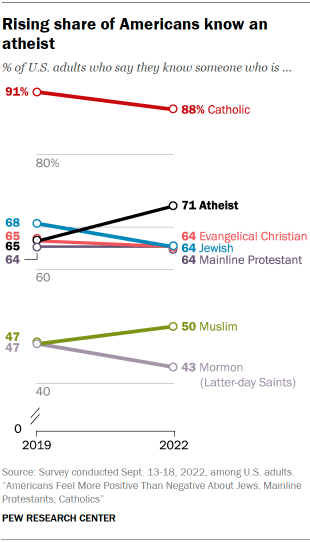
With some exceptions, most Americans are personally acquainted with members of the religious groups that the survey examined. For instance, nearly nine-in-ten Americans (88%) know someone who is Catholic.
A rising share of Americans also personally know an atheist. In 2019, 65% of Americans reported that they knew an atheist; in the new survey, 71% say the same.
Nearly two-thirds of U.S. adults know someone who is evangelical Christian, Jewish or mainline Protestant (64% each). Americans are less likely to personally know a Muslim (50%) or a Mormon (43%).
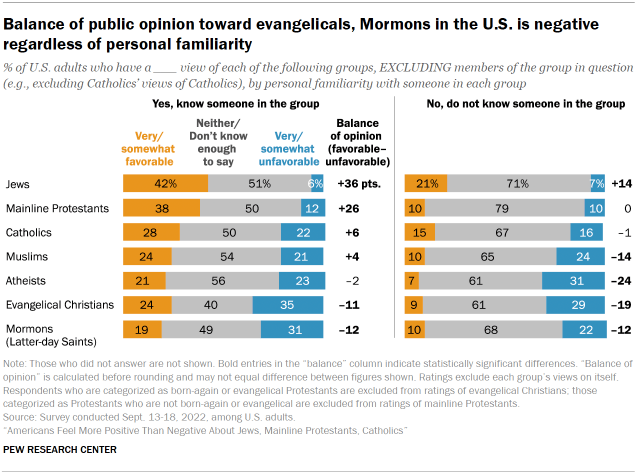
Across the board, those who know someone from a religious group (but are not members of that group themselves) are more likely than those who do not know someone in the group to offer an opinion of the group – and usually to express more positive feelings. For example, about four-in-ten non-Jews who know a Jewish person (42%) express positive views of Jews, double the share among non-Jews who do not personally know someone in this religious group (21%). However, the share of non-Jews who express a negative view toward Jews is similar regardless of whether they know someone who is Jewish or do not (6% and 7%, respectively).
Americans who say they personally know a mainline Protestant are about three times as likely to rate mainline Protestants positively (38%) as negatively (12%). Among those who do not personally know a mainline Protestant, meanwhile, identical shares hold favorable and unfavorable views of the group (10% each); most (79%) do not offer an opinion.
People who are not Muslim but know someone who is Muslim also are slightly more likely to express a favorable (24%) rather than unfavorable (21%) view of Muslims.
The balance of opinion toward evangelical Christians is negative both among those who know someone who is an evangelical Christian (-11 percentage points) and among those who do not (-19 points). While those who know an evangelical Christian are more likely than those who do not to express a positive view of the group (24% vs. 9%), they are also slightly more likely than those who do not personally know an evangelical Christian to express a negative view of evangelicals (35% vs. 29%). This same pattern applies to Mormons: Non-Mormons who know someone who is Mormon not only are more likely than those who don’t to express a favorable view toward Mormons (19% vs. 10%), but also are more likely to express an unfavorable view (31% vs. 22%).
Atheists have negative feelings about Christian groups in the U.S., and the feeling tends to be mutual
Catholics and mainline Protestants tend to be viewed more positively than negatively by other Christian groups. For instance, born-again or evangelical Protestants are more likely to say they hold favorable (37%) than unfavorable (14%) views of Catholics.
The same is not true for views toward evangelical Christians and Mormons. On balance, Catholics and Protestants who are not born-again/evangelical are about as likely to express unfavorable views of evangelical Christians as they are to express favorable views.
And although 54% of Mormons feel positively toward evangelical Christians, the feelings are not reciprocal: 15% of born-again or evangelical Protestants feel positively toward Mormons, compared with 27% who express negative views.
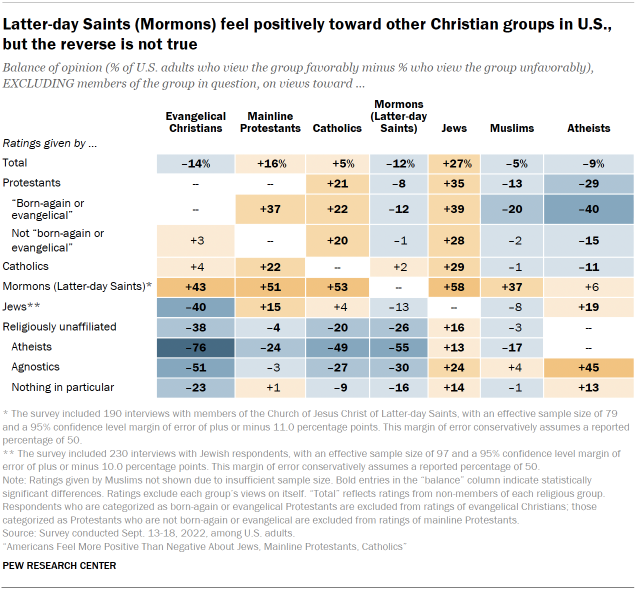
Among all the religious groups asked about, only Jews universally receive net positive ratings from all other groups. While 81% of Jews rate their own group favorably, Christians across various subgroups also rate Jews much more favorably than unfavorably. For example, 45% of Protestants who describe themselves as born-again or evangelical view Jews favorably, compared with 6% who have an unfavorable view toward Jews. (The survey did not include enough interviews with Muslim Americans to accurately measure their views toward Jews or any other group. Read more about how we report the views of smaller U.S. religious groups.)
Jews are the only religious group who receive a positive rating, on balance, from atheists (+13 percentage points), aside from atheists’ ratings of their own group. Jews also are more likely to express positive than negative views toward atheists. By contrast, atheists feel overwhelmingly negative toward evangelical Christians (79% express unfavorable views, compared with 3% who express positive views). Atheists also are more negative than positive toward Catholics, mainline Protestants, Mormons and Muslims. The negative feelings are mutual when it comes to Protestants and Catholics, who give atheists net negative ratings.
Within most religious groups, similar shares view Muslims negatively and positively, although some groups (such as born-again or evangelical Protestants and atheists) view Muslims more negatively than positively. Mormons are the only group who express a net positive opinion toward Muslims, with 47% reporting favorable views and 11% reporting unfavorable views.
In fact, Mormons do not express a net negative opinion toward any group in the survey, and are strongly positive toward several.
More than a third of Americans hold unfavorable views of multiple religious groups
Most U.S. adults do not express negative feelings toward multiple religious groups. In fact, about four-in-ten Americans (41%) do not express an unfavorable view toward any group mentioned in the survey. And roughly one-quarter express a negative view of just one group, with atheists and evangelical Christians the most likely to be singled out.
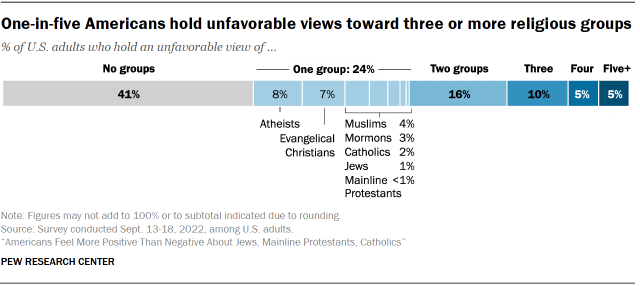
It is less common for people to have unfavorable views toward two (16%) or three (10%) groups. And even fewer express negative opinions of four groups (5%) or five or more (5%). Still, more than one-third of Americans have an unfavorable view of at least two religious groups, prompting the question: What are the most common patterns within this segment of the population?
To help answer this question, researchers used a statistical technique called factor analysis, which detects underlying patterns in how Americans rate all seven religious groups. This analysis identifies two relatively common patterns (“factors”) behind the variation in responses.
The first is characterized by unfavorable views of multiple religious groups other than atheists. Overall, 9% of U.S. adults express an unfavorable view of two or more religious groups accompanied by a favorable view of atheists. This pattern is most common among atheists themselves, agnostics, and Democrats and independents who lean toward the Democratic Party.
The second factor is characterized by favorable views of evangelical Christians, together with unfavorable views of atheists and Muslims. Overall, 7% of U.S. adults express a favorable view of evangelical Christians along with unfavorable views of both atheists and Muslims. This pattern is most common among Republicans and Republican leaners (13%) and White evangelical Protestants (25%).
Moreover, most Americans who hold an unfavorable view of Jews also hold an unfavorable view of Muslims, but most people who hold an unfavorable view of Muslims do not express negative views of Jews. Overall, 4% of U.S. adults hold a negative view of both groups. Just 2% hold an unfavorable view of Jews but not Muslims, while a far larger share holds an unfavorable view of Muslims but not Jews (18%).
Partisan differences in opinions on U.S. religious groups
There are notable differences in attitudes toward religious groups when examined by political party affiliation. Republicans and GOP leaners hold, on balance, more favorable than unfavorable views of evangelical Christians and Catholics. (Again, this analysis only includes people who are not members of the group being rated; for example, Republicans’ ratings of evangelical Christians only include Republicans who are not evangelical or born-again Protestants.) By contrast, Democrats and Democratic leaners view evangelicals much more negatively than positively and are as likely to view Catholics unfavorably as favorably. On balance, both Republicans and Democrats view Mormons negatively, although the margin is wider among Democrats (18 percentage points) than Republicans (5 points).
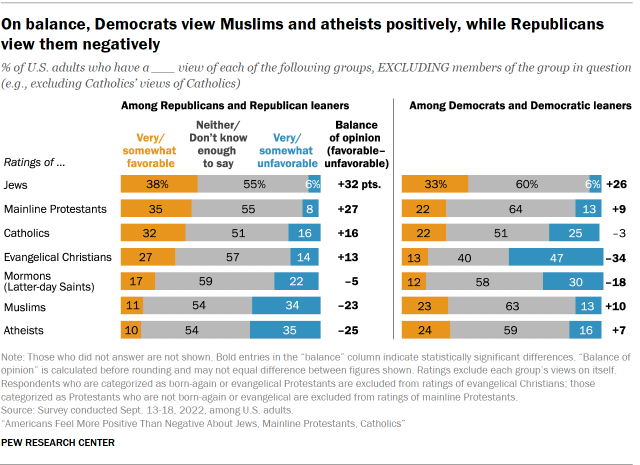
Both Republicans and Democrats tend to view Jews favorably. About four-in-ten Republicans say they see Jews positively (38%), as do one-third of Democrats (33%). Identical shares view them negatively (6% each).
But there are much bigger partisan gaps in views toward other non-Christians. Republicans are more likely to express negative than positive sentiments toward atheists and Muslims, while the reverse is true of Democrats, who are more favorable than unfavorable toward these groups. Both atheists and Muslims lean heavily Democratic, although the same is true of Jews.