A majority view the U.S. positively and see it as the world’s leading economic power of the next decade
Pew Research Center conducted this analysis to understand Asian Americans’ views of their ancestral homelands and the U.S. It highlights the attitudes and opinions on global affairs of all U.S. Asian adults as well as the specific views of Chinese, Filipino, Indian, Japanese, Korean, Taiwanese and Vietnamese adults in the U.S. This report is the latest in the Center’s in-depth analyses of public opinion among Asian Americans.
The data in this report comes from a nationally representative survey of 7,006 Asian adults that explores the experiences, attitudes and views of Asians living in the U.S. on several topics, including identity, affirmative action and global affairs. The survey sampled U.S. adults who self-identify as Asian, either alone or in combination with other races or Hispanic ethnicity. It was offered in six languages: Chinese (Simplified and Traditional), English, Hindi, Korean, Tagalog and Vietnamese. Responses were collected from July 5, 2022, to Jan. 27, 2023, by Westat on behalf of Pew Research Center.
The Center recruited a large sample to examine the diversity of the U.S. Asian population, with oversamples of Chinese, Filipino, Indian, Korean and Vietnamese populations. These are the five largest origin groups among Asian Americans. The survey also includes a large enough sample of self-identified Japanese adults to make findings about them reportable. Findings for Taiwanese adults are likewise reportable and accompanied with margins of sampling error in charts. In this report, the seven Asian origin groups highlighted include those who identify with one Asian origin only, either alone or in combination with a non-Asian race or ethnicity. Together, these seven groups constitute 81% of all U.S. Asian adults, according to a Pew Research Center analysis of the Census Bureau’s 2021 American Community Survey (ACS). For more information on how we defined our sample of Taiwanese adults – and the other Asian origin groups – refer to the appendix.
Survey respondents were drawn from a national sample of residential mailing addresses, which included addresses from all 50 states and the District of Columbia. Specialized surnames list frames maintained by the Marketing Systems Group were used to supplement the sample. Those eligible to complete the survey were offered the opportunity to do so online or by mail with a paper questionnaire. For details, refer to the methodology. For questions used in this analysis, refer to the topline questionnaire.
Survey results were complemented by 66 pre-survey focus groups of Asian adults, conducted from Aug. 4 to Oct. 14, 2021, with 264 recruited participants from 18 Asian origin groups. Focus group discussions were conducted in 18 different languages and moderated by members of their origin groups. In the focus groups, participants were asked about their opinions of the places they trace their heritage to, and some quotations are used in this report. Quotations are not necessarily representative of the majority opinion in any particular group or in the United States. Quotations may have been edited for grammar, spelling and clarity.
Pew Research Center is a subsidiary of The Pew Charitable Trusts, its primary funder. The Center’s Asian American portfolio was funded by The Pew Charitable Trusts, with generous support from The Asian American Foundation; Chan Zuckerberg Initiative DAF, an advised fund of the Silicon Valley Community Foundation; the Robert Wood Johnson Foundation; the Henry Luce Foundation; the Doris Duke Foundation; The Wallace H. Coulter Foundation; The Dirk and Charlene Kabcenell Foundation; The Long Family Foundation; Lu-Hebert Fund; Gee Family Foundation; Joseph Cotchett; the Julian Abdey and Sabrina Moyle Charitable Fund; and Nanci Nishimura.
We would also like to thank the Leaders Forum for its thought leadership and valuable assistance in helping make this survey possible.
The strategic communications campaign used to promote the research was made possible with generous support from the Doris Duke Foundation.
The terms Asians, U.S. Asian adults and Asian Americans are used interchangeably throughout this report to refer to U.S. adults who self-identify as Asian, either alone or in combination with other races or Hispanic identity.
Asian origins and origin group labels, such as Chinese and Chinese origin, are used interchangeably in this report for findings for Asian origin groups, such as Chinese, Filipino, Indian, Japanese, Korean, Taiwanese or Vietnamese. Origin groups in this report include those who report being one Asian origin only, either alone or in combination with a non-Asian race or ethnicity. For this report, Chinese adults do not include those who self-identify as Taiwanese. For more information on how we defined the Taiwanese sample, refer to the appendix.
Ancestral homeland is used in this report to refer to the place in Asia that people trace their ancestry or heritage to, including the place they are from or the place their family or ancestors are from. It is used interchangeably with homeland, homeland of their ancestors, homeland of their heritage, place of origin and place they trace their heritage to throughout this report.
To make comparisons between a specific Asian origin group and the rest of the U.S. Asian population, other Asian adults is used in this report to refer to Asian adults who report being some other Asian origin than the one highlighted. This includes those who report being another Asian origin, either alone or in combination with a non-Asian race or ethnicity, or two or more Asian origins.
Immigrants in this report are people who were not U.S. citizens at birth – in other words, those born outside the U.S., Puerto Rico or other U.S. territories to parents who are not U.S. citizens. Immigrant, foreign born and born abroad are used interchangeably to refer to this group.
Naturalized citizens are immigrants who are lawful permanent residents who have fulfilled the length of stay and other requirements to become U.S. citizens and who have taken the oath of citizenship.
U.S. born refers to people born in the 50 U.S. states or the District of Columbia, Puerto Rico or other U.S. territories.
Primary language is a composite measure based on self-described assessments of speaking and reading abilities. People who are origin language dominant are more proficient in the Asian origin language of their family or ancestors than in English (i.e., they speak and read their Asian origin language “very well” or “pretty well” but rate their ability to speak and read English lower). Bilingual refers to those who are proficient in both English and their Asian origin language. People who are English dominant are more proficient in English than in their Asian origin language.
Throughout this report, the phrases Democrats and Democratic leaners and Democrats refer to respondents who identify politically with the Democratic Party or who are independent or identify with some other party but lean toward the Democratic Party. Similarly, the phrases Republicans and Republican leaners and Republicans both refer to respondents who identify politically with the Republican Party or are independent or identify with some other party but lean toward the Republican Party.
The terms Republican Party and GOP are used interchangeably in this report.
In separate surveys in 2023, Pew Research Center measured U.S. adults’ attitudes toward China, India, Taiwan, the U.S. and other countries. And in past years, the Center has also evaluated U.S. adults’ views of Japan and other Asian countries.
Broadly speaking, in 2023, the views of Asian Americans are similar to those of the American public. For example, 20% of Asian Americans have a favorable view of China, as does 14% of the American public. By contrast, around three-quarters of both groups see the U.S. in a positive light, and majorities of both have favorable views of Taiwan.
Still, there are some differences between how Asian Americans see certain places and how the general public does – related both to differences in who was surveyed (the sample) and how the question was asked. In particular, Asian Americans were asked about their opinion using a five-point scale that allowed them to say they had very favorable, somewhat favorable, neither favorable nor unfavorable, somewhat unfavorable or very unfavorable views. The general public, on the other hand, was given a four-point scale that did not have the option of saying that they had neither a favorable nor unfavorable opinion. For more on how views of foreign countries may differ based on the inclusion of a neutral option, read our post, “What different survey modes and question types can tell us about Americans’ views of China.”
Pew Research Center has a long history of measuring Americans’ views of the United States, China and other countries, but less is known about Asian Americans’ views of these countries. Amid the American public’s increasingly negative views of China and rising concern over tensions between mainland China and Taiwan, how do Asian Americans feel about the homelands in Asia to which they trace their heritage, as well as about the U.S., China and elsewhere?
Jump to:
- Chinese Americans’ views of China and other places
- Filipino Americans’ views of the Philippines and other places
- Indian Americans’ views of India and other places
- Japanese Americans’ views of Japan and other places
- Korean Americans’ views of South Korea and other places
- Taiwanese Americans’ views of Taiwan and other places
- Vietnamese Americans’ views of Vietnam and other places
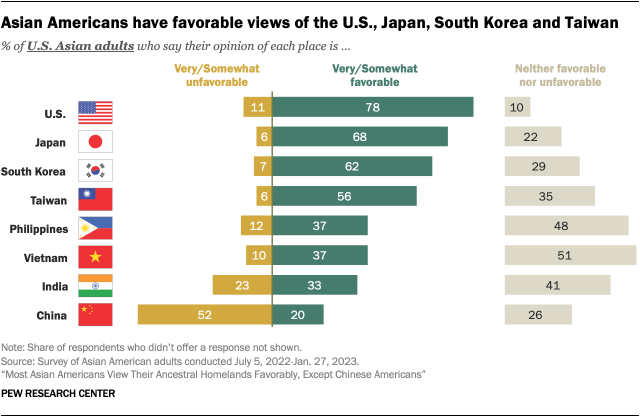
Around three-quarters of Asian Americans (78%) have a favorable view of the United States – including 44% who report very favorable views of the country. A majority also say they have positive views of Japan (68%), South Korea (62%) and Taiwan (56%), according to a new analysis of a multilingual, nationally representative survey of Asian American adults conducted from July 5, 2022, to Jan. 27, 2023.
Opinion of Vietnam, the Philippines and India is more mixed. In the case of both Vietnam and the Philippines, 37% of Asian adults have positive views, while around half say they have neither favorable nor unfavorable views, and only around one-in-ten see the countries in a negative light. Meanwhile, 33% of Asian Americans have favorable views of India, 41% report a neutral view and 23% view it unfavorably.
Asian Americans have predominantly negative views of China. Only 20% of Asian adults have a favorable opinion of China, compared with 52% who have an unfavorable opinion and 26% with neither a favorable nor unfavorable opinion.
Asian Americans have largely favorable views of their ancestral homelands
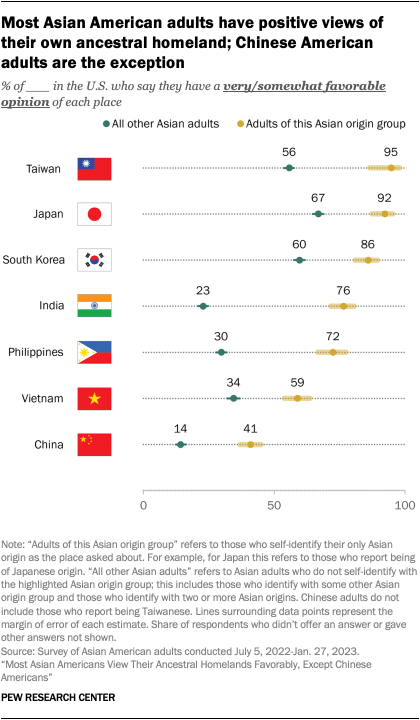
Overall, Asian Americans have positive views of the places they trace their heritage to. About nine-in-ten Taiwanese and Japanese Americans say their opinion of their own ancestral homeland is very or somewhat favorable, as do large majorities of Korean, Indian and Filipino adults. A smaller majority of Vietnamese Americans say they have a favorable view of Vietnam.
By contrast, Chinese Americans have more mixed views of China.1 Fewer than half say they hold a favorable opinion. Still, a larger share of Chinese Americans have a positive opinion of China than other Asian adults,2 41% vs. 14%.
Origin groups also see their ancestral homelands much more favorably than other Asian adults. Among the seven origin groups highlighted in this report, the difference is largest on views of India: 76% of Indian adults have a favorable opinion of India, compared with 23% of other Asian adults, a gap of 53 percentage points. The gap is smallest on views of Vietnam, though there is still a sizable difference: 59% of Vietnamese adults have a favorable view versus 34% of other Asian adults, a 25-point difference.
Chinese and Vietnamese adults are the only origin groups in this analysis to express more favorable views of other places in Asia than their homelands. Chinese adults see Japan, Taiwan and South Korea more favorably than they do China. Vietnamese adults see Japan more favorably than they do Vietnam.
Chinese Americans favor Taiwan over China
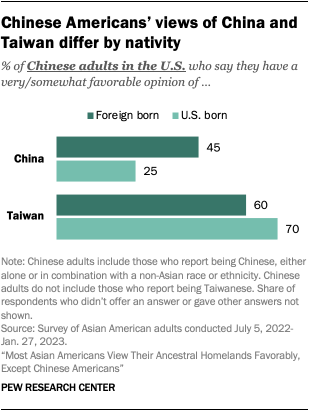
Amid rising tensions between mainland China and Taiwan, Chinese Americans’ favorability of Taiwan over China is particularly notable: 62% of Chinese Americans say they have a favorable view of Taiwan, higher than the share that says the same about China (41%).
Even so, Chinese Americans’ views of China and Taiwan vary depending on where they were born and, for immigrants, how long they have lived in the United States:
- Chinese immigrant adults are more likely than U.S.-born Chinese adults to have a favorable view of China (45% vs. 25%).
- On their views of Taiwan, Chinese immigrants are somewhat less likely than those born in the U.S. to have a favorable opinion (60% vs. 70%).
Favorability of Asian Americans’ ancestral homelands varies across some origin groups
Asian origin groups differ in their assessments of some of the places asked about in the survey. Some groups stand out for their general positivity toward most places, as in the case of Filipinos. Others vary widely depending on which specific place is asked about. For instance:
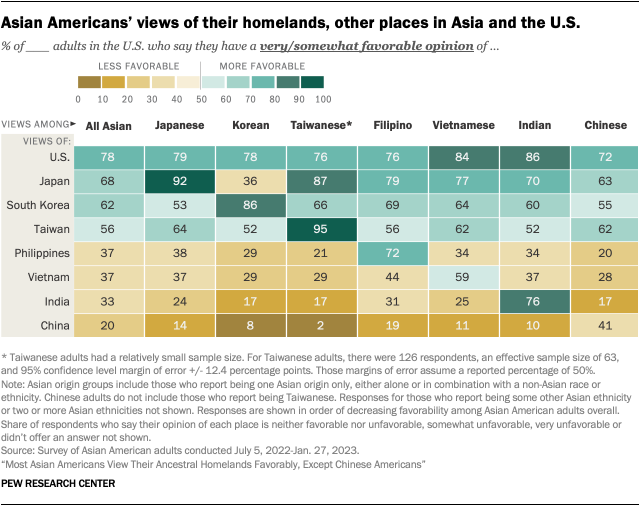
- Asian Americans overall have majority favorable views of Japan. But Korean Americans stand out: Only 36% have positive views of Japan.
- By comparison, Japanese Americans’ views of South Korea are more positive, at 53%. Still, Japanese and Chinese Americans’ evaluations of South Korea are slightly less favorable than the views among other origin groups – especially Filipino adults.
- Indian adults in the U.S. are around three times as likely as almost any other Asian origin group to have favorable views of India. While 76% of Indian Americans have favorable views of India, the next highest ratings come from Filipino Americans – only 31% of whom agree. Ratings of India are particularly negative among Chinese and Korean adults in the U.S.
- Few Asian adults overall have favorable views of China, though there is some variation across origin groups. While 19% of Filipino adults in the U.S. have a favorable opinion of China, smaller shares of Indian (10%), Korean (8%) and Taiwanese adults (2%) say the same.3
Favorability varies across nativity, education and other demographic factors
Foreign-born and U.S.-born Asian Americans differ in their views of certain places:
- In most cases, Asian immigrants express more positive views of the places they trace their heritage to than U.S.-born Asian adults.
- Foreign-born Asian adults have much more favorable views of the United States than those born in the U.S. (83% vs. 64%).
- Asian immigrants also have slightly more positive views of India and China than U.S.-born Asian adults. There are no differences between foreign- and U.S.-born Asian Americans when it comes to any of the other places asked about in the survey.
Asian Americans with higher levels of educational attainment often feel more positively about the places they were asked about than those with lower levels of formal schooling:
- When it comes to views of India, 42% of those with a postgraduate degree have favorable views of the country, compared with 35% of those with a bachelor’s degree and 27% of those with less formal schooling.
- The pattern is reversed, though, when it comes to China. Asian Americans with lower levels of education tend to feel more positively about China than those with more education. For example, 17% of those with at least a bachelor’s degree have positive views of China, compared with 23% of those who did not complete college.
Overall, there is little variation in attitudes by party identification. This lack of difference is notable on views toward China. Nearly identical shares of Republican and Democratic Asian Americans see the country positively (20% and 18%, respectively) and negatively (55% and 52%). This departs from trends seen among the general U.S. public: Our past analyses have found that Republicans are more likely than Democrats to hold an unfavorable opinion of China.
Most Asian adults would not move to their ancestral homelands
While Asian adults have largely favorable views of their ancestral homelands, most say they would not move (or, in some cases, move back) there if they had the chance. Nearly three-quarters of Asian adults say this, while 26% say they would.
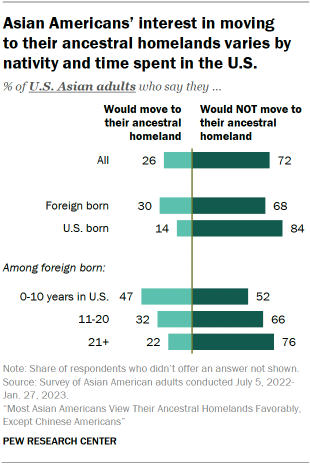
Asian immigrants are twice as likely as those who are U.S. born to say they would move to the homelands of their heritage (30% vs. 14%).
Likewise, interest in moving to their homelands is lower among immigrants who have been in the U.S. for a longer time. About half (47%) of Asian immigrants who have been in the U.S. for 10 years or less say they would move to their ancestral homeland, compared with roughly one-in-five (22%) who have been in the U.S. for more than 20 years.
Asian Americans’ response to this question differs somewhat across origin groups. Willingness to move to the places they trace their heritage to ranges from a low of 16% among Chinese Americans to a high of 33% among Indian Americans. And among many origin groups, immigrants are more likely to say that they would move there than those born in the U.S.
Among the 26% of Asian Americans who say they would move to the homeland of their ancestors, top reasons include proximity to friends or family (36%) and a lower cost of living (22%). Smaller shares also pointed to greater familiarity with the culture, better support for older people and feeling safer there.
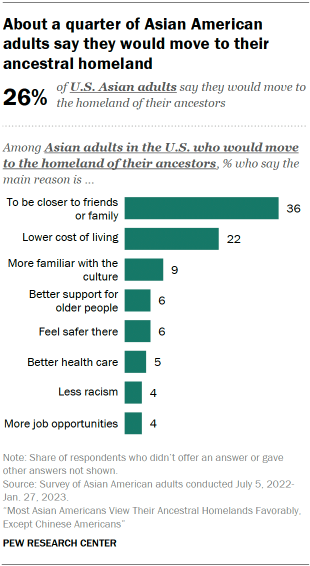
The survey also finds the main reasons Asian Americans say they would move to their places of origin varies across some Asian origin groups:4
- Chinese adults who say they would move to China would do so to be closer to family and friends (27%) and because they are more familiar with Chinese culture (24%).
- Filipino adults who say they would move to the Philippines would do so for the lower cost of living (47%) and to be closer to friends or family (35%).
- Half of Indian adults who say they would move to India would do so because of its lower cost of living (52%).
- Korean adults who say they would move to South Korea would do so for better health care (24%) and to be closer to family and friends (22%).
- Vietnamese adults who say they would move to Vietnam would do so for its lower cost of living (35%) and to be closer to friends and family (32%).
Majority of Asian Americans see the U.S. as the world’s leading economic power in the next decade
About half of Asian Americans (53%) say the United States will be the world’s leading economic power over the next decade. Roughly one-third (36%) say China will be the leading economic power globally in the next 10 years, and much lower shares say the same of India and Japan.
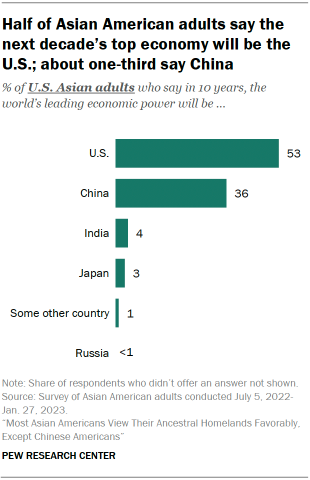
These views are broadly consistent with those of the American public. In a March 2023 survey using a slightly different question asking which of four places – the U.S., China, the EU or Japan – is currently the world’s leading economic power, 48% named the U.S. and 38% China.
Views of the next decade’s top economy vary across place of birth and age:
- Among Asian immigrants, 57% see the U.S. as the leading economic power, while just 32% say it will be China.
- U.S.-born Asian adults are roughly divided over whether the U.S. or China will be the top economy (43% vs. 46%).
- Older Asian Americans are more likely than younger ones to say the U.S. will be the top economy: 62% of Asian adults ages 65 and older name the U.S. as the next decade’s leading economic power, compared with 49% of those under 50.
Views of the world’s leading economic power by Asian origin group
Asian adults are more likely to say the U.S. will be the leading economic power in 10 years than China. Still, origin groups differ in the degree to which they see this pattern.
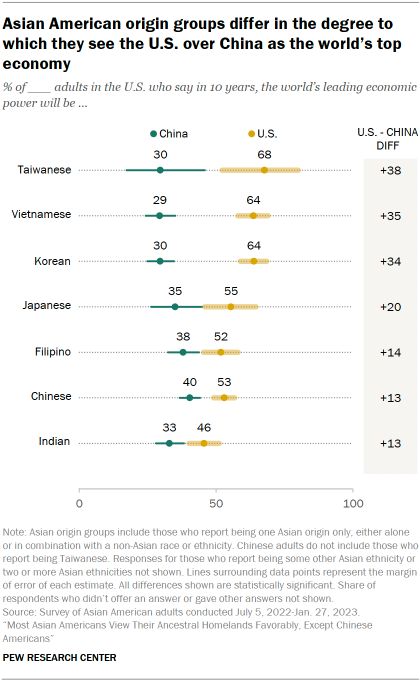
For example, Chinese adults are somewhat more divided than most other groups, with 53% naming the U.S. as the top power compared with 40% who name China. This gap of 13 percentage points is much smaller than the gap of 38 points between the U.S. and China among Taiwanese adults, or the gap of 20 points or more among Vietnamese, Korean and Japanese Americans.
Indian adults are also the most likely to say India will be the world’s leading economic power, with 15% holding this view. No more than 2% of any other origin group highlighted in this report say the same.
Japanese (5%) and Filipino (6%) adults are also relatively more likely than most other origin groups to describe Japan as the next decade’s leading economic power than other origin groups – though the absolute share who see Japan this way (3%) still pales in comparison to those who name China or the U.S.
The remainder of this report explores in depth the views of each of the seven origin groups – Chinese, Filipino, Indian, Japanese, Korean, Taiwanese and Vietnamese adults in the U.S.


