In this report, we have chosen to separate the Chinese and Taiwanese samples in the 2022-23 survey of Asian American adults to discuss differences in attitudes on several geopolitical issues. In the sample of Taiwanese adults, we include only those who self-identify as Taiwanese alone. For more information on how we defined the survey’s Taiwanese sample, refer to the appendix.
We are unable to report on subgroup differences among Taiwanese adults in the U.S. This is because the sample included too few Taiwanese adults to make reliable estimates of smaller demographic subgroups (e.g., Taiwanese men, Taiwanese women, Taiwanese adults under 50, etc.).
In the 2022-23 survey of Asian Americans, we conducted 126 raw interviews with self-identified Taiwanese adults. That yields an effective sample size of 63 and a 95% confidence level margin of error (which assumes a reported percentage of 50%) of +/- 12.4 percentage points. Due to the relatively small sample size, we have chosen to display margins of sampling error in charts while reporting on views of Taiwanese adults overall. However, among demographic subgroups within Taiwanese adults, the sample sizes do not fulfill the Center’s requirements for responsible reporting on small subgroups. For more information, read our explainer on why we display margins of error in some graphics.
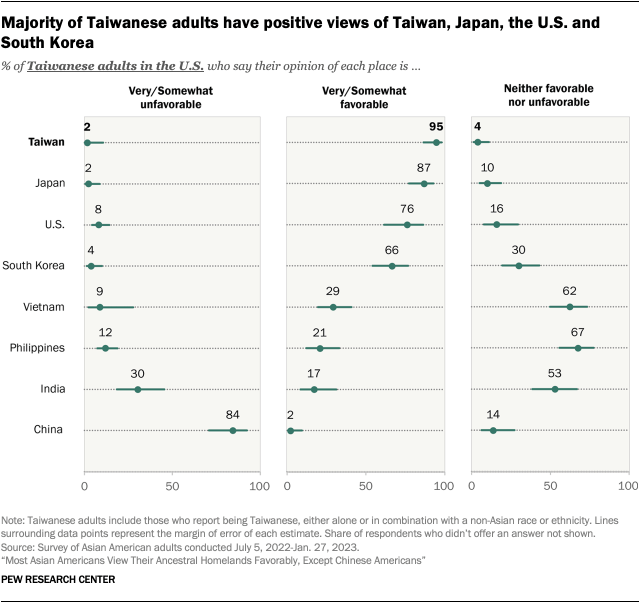
A large majority of Taiwanese Americans (95%) hold a favorable view of Taiwan, including 75% who say their opinion is very favorable.
Though nearly all Taiwanese adults in the U.S. have a positive attitude toward Taiwan, only three-in-ten say they would consider moving there, our survey analysis finds.
“It’s about the future, a better future and the hope for changes. The U.S. is a major democratic country, and so is Taiwan. But they are different. That is why we want to come here to observe how a real democracy works. How does a real two-party system work? … [A]s a Taiwanese living in the U.S., we want to understand what the U.S. stance on Taiwan is. That is whether they recognize Taiwan as a country…. This is a much-debated issue.”
– Immigrant man of Taiwanese origin, age 37 (translated from Mandarin)
About nine-in-ten have a positive view of Japan, and roughly three-quarters see the U.S. positively. South Korea is also seen favorably by about two-thirds of Taiwanese Americans.
Taiwanese Americans generally hold neither favorable nor unfavorable views of Vietnam, the Philippines and India.
“For me, I think one of the biggest things that defines being Taiwanese American is the political struggle with China, and also the fact that Taiwan had gone through industrialization as part of the Four Tigers, whereas China is going through it now. Also, China is a much larger region with its own different backgrounds for each area and differences in cuisine and stuff like that. So there is a lot more to being Chinese, whereas the Taiwan culture is a little bit more uniform, but it’s still different.”
– U.S.-born man of Taiwanese origin, age 32
Taiwanese Americans see China the most unfavorably out of the places they were asked about. Just 2% of Taiwanese U.S. adults have a positive opinion of China. Conversely, 84% have an unfavorable view of China, including 62% who have a very unfavorable view.11
Taiwanese Americans’ views of many of the places included in the survey differ significantly from those of other Asian Americans.12 They are much more likely than other Asian adults to hold a favorable view of Taiwan (95% vs. 56%) and Japan (87% vs. 68%). Compared with other Asian Americans, they also hold less positive views of China (2% vs. 20%).