Views about selective higher educational institutions taking race and ethnicity into account in their admissions decisions differ widely by race and ethnicity, age, educational attainment and partisan affiliation.
Race and ethnicity
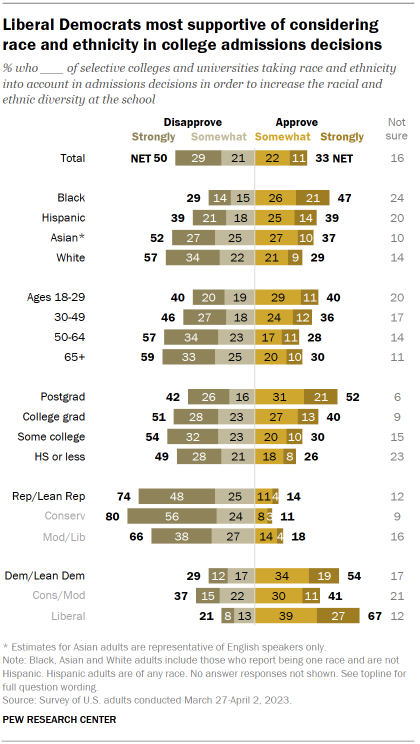
Black adults stand out for expressing more support than opposition to these practices, with 47% approving and 29% disapproving. About a quarter of Black adults (24%) say they are not sure.
Hispanic adults are split in their views: About four-in-ten say they approve (39%) of colleges taking race and ethnicity into account, while an identical share say they disapprove. Two-in-ten say they are not sure.
About half of Asian adults (52%) say they disapprove of race and ethnicity being factored into admissions decisions to increase diversity, while a smaller share (37%) approve.
White adults are less likely than those in other groups to approve of these practices, with nearly six-in-ten (57%) disapproving of them and about three-in-ten (29%) approving.
Age
Adults under age 30 are evenly split: 40% approve of colleges considering race and ethnicity in admissions decisions, while the same share disapprove and 20% are unsure. Among adults ages 30 to 49, there is more opposition (46%) than support (36%). Opposition is particularly pronounced among those 50 and older – nearly six-in-ten (58%) of whom say they disapprove of colleges adopting these practices in their admissions decisions.
Education
Adults with a postgraduate degree (52%) are much more likely than adults with a bachelor’s degree (40%), some college experience (30%), or a high school diploma or less education (26%) to say they approve of colleges considering race and ethnicity in admissions decisions.
Those with some college experience or less education are more likely than those with a college degree or more education to say they are unsure of their opinions about these practices (20% vs. 8%).
Partisanship and ideology
Some of the widest divides on this issue are seen by political party: Roughly three-quarters of Republicans and Republican-leaning independents (74%) say they disapprove of the consideration of race and ethnicity in the college admissions process, while 14% say they approve and 12% say they are unsure.
While majorities of both conservative (80%) and moderate and liberal Republicans (66%) say they disapprove of these practices, this view is more widespread among conservative Republicans, who also are more likely to strongly disapprove of this than moderate and liberal Republicans (56% vs. 38%).
By contrast, more than half of Democrats and Democratic leaners (54%) say they approve of selective colleges and universities taking race and ethnicity into account when making admissions decisions, while 29% say they disapprove of this process and 17% say they are unsure.
Liberal Democrats are particularly supportive of considering race and ethnicity as a factor in college admissions in order to increase the racial and ethnic diversity of the school: Two-thirds say they approve of this, while 21% disapprove. Conservative and moderate Democrats are divided on this question: About four-in-ten conservative and moderate Democrats (41%) say they approve of these practices, while a similar share (37%) express disapproval and 21% are unsure.
Within both parties, racial and ethnic differences on considering race and ethnicity in college admissions
Republicans
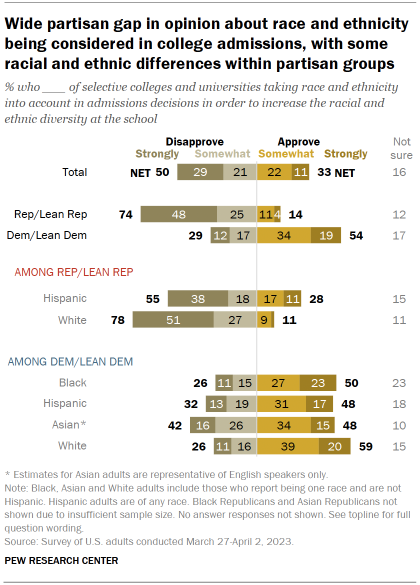
Majorities of both White and Hispanic Republicans disapprove of selective educational institutions taking race and ethnicity into account in admissions decisions in order to increase the racial and ethnic diversity at the school. However, this view is more prevalent among White Republicans (78% disapprove, 11% approve) than Hispanic Republicans (55% disapprove, 28% approve).
Democrats
Roughly six-in-ten White Democrats (59%) approve of race and ethnicity being considered in college admissions decisions, while about a quarter (26%) oppose this. An identical share of Black Democrats express opposition to these practices, while half express support. Black Democrats are more likely than White Democrats to say they’re unsure (23% vs. 15%).
About half of Hispanic Democrats (48%) say they approve of race and ethnicity being considered in college admissions decisions. Views among Asian Democrats are fairly divided: 48% say they approve of these practices, and 42% say they disapprove.
College graduates more likely than others to approve of considering race and ethnicity in college admission processes
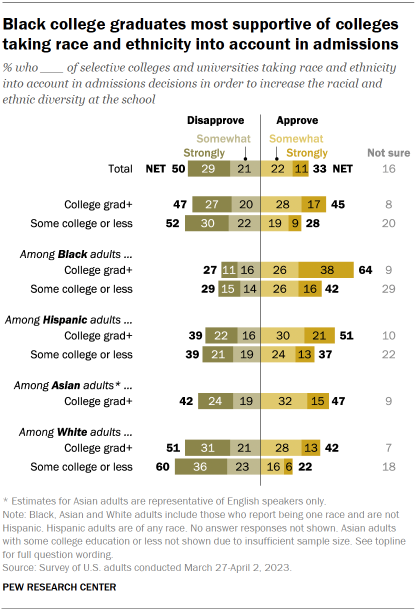
Across racial and ethnic groups, adults with a bachelor’s degree or more education are more likely than those without a bachelor’s degree to approve of the consideration of race and ethnicity in college admissions. And regardless of educational level, Black adults are least likely (and White adults most likely) to oppose these practices.
Overall, 45% of college graduates approve of considering race and ethnicity as a factor in admissions decisions, while a similar share (47%) disapprove. By comparison, those without a bachelor’s degree are nearly twice as likely to disapprove as they are to approve (52% vs. 28%). Those without a college degree are substantially more likely than those with at least a bachelor’s degree (20% vs. 8%) to say they are not sure about these practices.
By more than two-to-one, Black adults with a bachelor’s degree or more formal education approve (64%), rather than disapprove (27%), of the consideration of race and ethnicity in admissions decisions for selective colleges and universities. Among Black adults without a college degree, support for these practices edges out opposition by a narrower margin (42% vs. 29%). Black adults without a college degree are about three times more likely to express uncertainty than those with a bachelor’s degree or more (29% vs. 9%).
Six-in-ten White adults without a four-year college degree oppose the consideration of race and ethnicity in college admissions, while roughly two-in-ten (22%) support it and 18% are unsure. White college graduates also are more likely to oppose than to support these practices, though by a narrower margin (51% disapprove, 42% approve, 7% say they are unsure).
Among Hispanic adults, those with a college degree are 14 percentage points more likely than those without a degree (51% to 37%) to approve of factoring race and ethnicity into college admissions, while 39% in both groups disapprove of this (22% of those without a degree say they are unsure, compared with 10% of those who have a bachelor’s degree or more education).