County-level 2016 vote classification
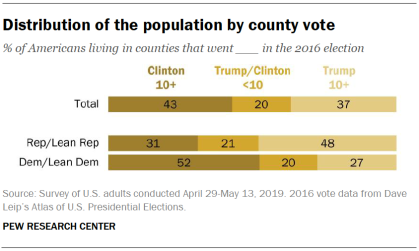
Respondents’ county-level 2016 vote share is used throughout this analysis. Counties were classified according to the proportion of the two-party vote (i.e., excluding third party candidate vote totals from the denominator), using county vote totals found in Dave Leip’s Atlas of U.S. Presidential Elections. For instance, Trump by 10+ counties are those where Donald Trump received more than 55% of the two-party vote, while Clinton by 10+ counties are those where Hillary Clinton received more than 55% of the two-party vote.
Respondents are classified into their counties using their exact address if available (99.5% of respondents). For the 0.6% of panelists without an exact address on file, panelists were matched with whatever geographic information was available (in most cases ZIP code). The 23 respondents (0.2% of the total sample) living in Alaska were excluded from these analyses as county vote totals are not available in Alaska.
Overall, about four-in-ten (43%) Americans live in counties that Clinton won by 10 points or more in the 2016 election. A similar share (37%) lives in counties won by Trump by 10 points or more.
Comfort with conflict scale
To gauge comfort level with conflict, the survey included three questions. These items were recoded and combined into a scale that is referenced throughout this report.
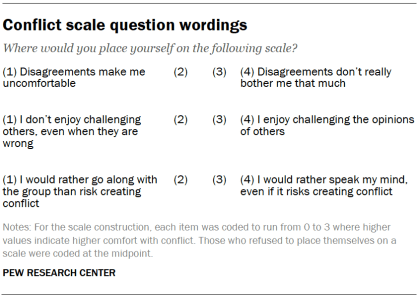
Respondents were asked to place themselves on three separate scales. Adding the responses to these scales together results in a scale that ranges from 0 to 9. A respondent who answered “(1) Disagreements make me uncomfortable,” “(1) I don’t enjoy challenging others, even when they are wrong,” and “(1) I would rather go along with the group than risk creating conflict” would score at the minimum of the scale. A respondent who selected “(4) Disagreements don’t really bother me that much,” “(4) I enjoy challenging the opinions of others,” and “(4) I would rather speak my mind, even if it risks creating conflict” would score at the maximum of the scale. Only 2% of the public scores at the minimum of the scale, and 10% of the public scores at the maximum.
Respondents are classified into three roughly equally sized groups based on this full scale. Those who score 0 to 4 on the scale are considered “Low comfort with conflict” (34% of adults fall into this group). Those with scores higher than 4 and up to 6 are classified as “Medium comfort with conflict” (36% of adults), and those with scores higher than 6 (with a maximum score of 9) on the full scale are classified as “High comfort with conflict.”
Women are less likely than men to have high levels of comfort with conflict. A plurality of women (42%) fall into the lowest category on the comfort with conflict scale. About a quarter of women express high levels of comfort with conflict (23%) while significantly more men (37%) fall into this category.
There are only modest differences in comfort with conflict across age groups, with those 65 years and older somewhat more likely to fall into the low end of the scale than those in other age groups.
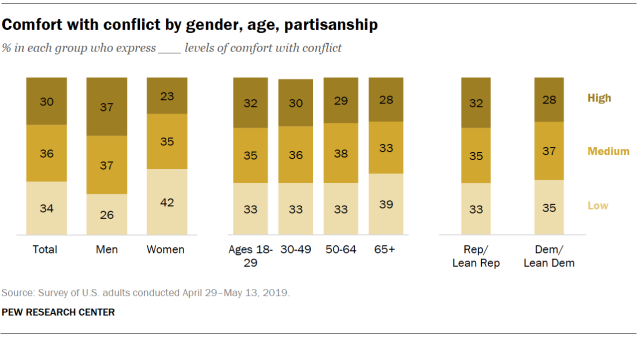
Partisan differences also are modest. Among Republicans and Republican-leaning independents, 33% express low levels of comfort with conflict, 35% have a medium level of comfort, while 32% have a high level of comfort with conflict. Democrats and Democratic leaners are slightly less likely than Republicans to fall on the high end of the scale (28% do so).
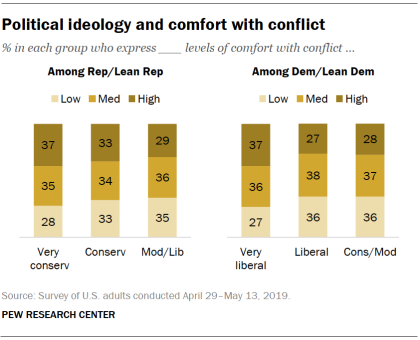
There are significant ideological differences within each party. Republicans who say they are “very” conservative ideologically (37%) are more likely to score high on the scale of comfort with conflict than Republicans who say they are moderate or liberal (29%).
The pattern is similar among Democrats: A greater share of very liberal Democrats (37%) than liberal (27%) or conservative and moderate Democrats (28%) have high comfort with conflict.
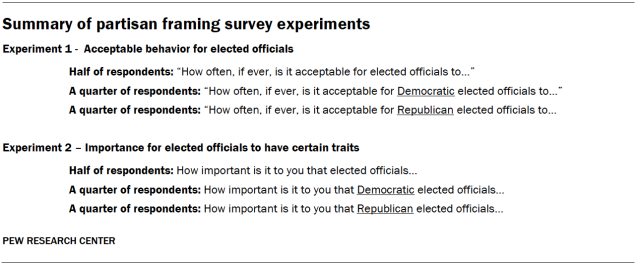
Partisan framing survey experiments
This report includes two batteries of questions about “elected officials” (the importance for elected officials to have certain traits and acceptable behavior for elected officials) in which random subsamples of respondents were asked the same questions either with or without partisan descriptions of elected officials. Respondents were randomly assigned to receive only one version of the questions in each case. This type of survey experiment allows analysts to examine the way responses among a group (e.g., the public as a whole, partisan groups, etc.) vary depending on differences in question wording.
In both survey experiments, a random quarter of respondents was asked about Democratic elected officials, while a different random quarter of respondents was asked about Republican officials. The remaining half of respondents were asked about “elected officials” without specifying any partisanship. See chapters 2 and 3 for the analysis of these questions.