Thermometer ratings
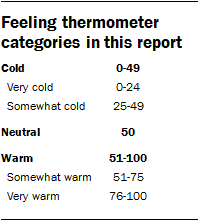
 The survey measured ratings toward a number of groups and people in the U.S. on a “feeling thermometer” ranging from zero (“as cold and negative as possible”) to 100 (“as warm and positive as possible”), with 50 as the neutral point. See topline for full question wording.
Throughout this report, ratings on the scale are grouped according to intensity as shown in the accompanying table.
Political engagement
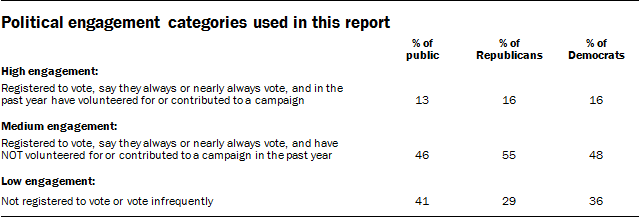
Throughout this report, a three category measure of political engagement is used.

Party issue agreement scale
The survey measured respondents’ proximity to the Republican and Democratic policy positions on nine issues. For each issue, respondents could say whether they strongly agree or somewhat agree with either the Republican Party or the Democratic Party, or that they don’t agree with either party. Seven of these issues (health care policy; policies to deal with illegal immigration; policies to deal with climate change; policies to deal with ISIS, the Islamic militant group in Iraq and Syria; abortion policy; gun policy; and policies to deal with the economy) were asked of all respondents and a scale of policy agreement was constructed. For instance, among Democrats, 42% agree (strongly or somewhat) with the Democratic Party on seven out of seven issues. Among Republicans, 38% agree with the Republican Party on seven out of seven issues.
Ideological consistency scale
The ideological consistency scale is composed of 10 questions asked on Pew Research Center surveys going back to 1994 to gauge peoples’ ideological worldview. The questions cover a range of political values including attitudes about size and scope of government, the social safety net, immigration, homosexuality, business, the environment, foreign policy and racial discrimination.
The scale is designed to measure how consistently liberal or conservative people’s responses are across these various dimensions of political thinking (what some refer to as ideological ‘constraint’). Though this measure is correlated with self-identified ideology, where people fall on this scale does not always align with whether they think of themselves as liberal, moderate or conservative.
The questions in the scale were asked on the initial recruitment surveys (either the 2014 Political Polarization and Typology Survey, conducted January 23rd to March 16th, 2014 or the 2015 Survey on Government, conducted August 27th to October 4th, 2015).
For more detail on the items in the scale, see here.


