
Pew Knight Initiative
The Pew-Knight Initiative supports new research on how Americans absorb civic information, form beliefs and identities, and engage in their communities.
Pew Research Center is a nonpartisan, nonadvocacy fact tank that informs the public about the issues, attitudes and trends shaping the world. Knight Foundation is a social investor committed to supporting informed and engaged communities. Learn more >
The landscape of local news in the United States has changed significantly in recent decades as Americans have been turning away from print and television and toward digital media. This fact sheet examines Americans’ experiences and preferences when it comes to local news, from data starting in 2016.
The fact sheet is part of the Pew-Knight Initiative, a research program funded jointly by The Pew Charitable Trusts and the John S. and James L. Knight Foundation.
Attention to local news
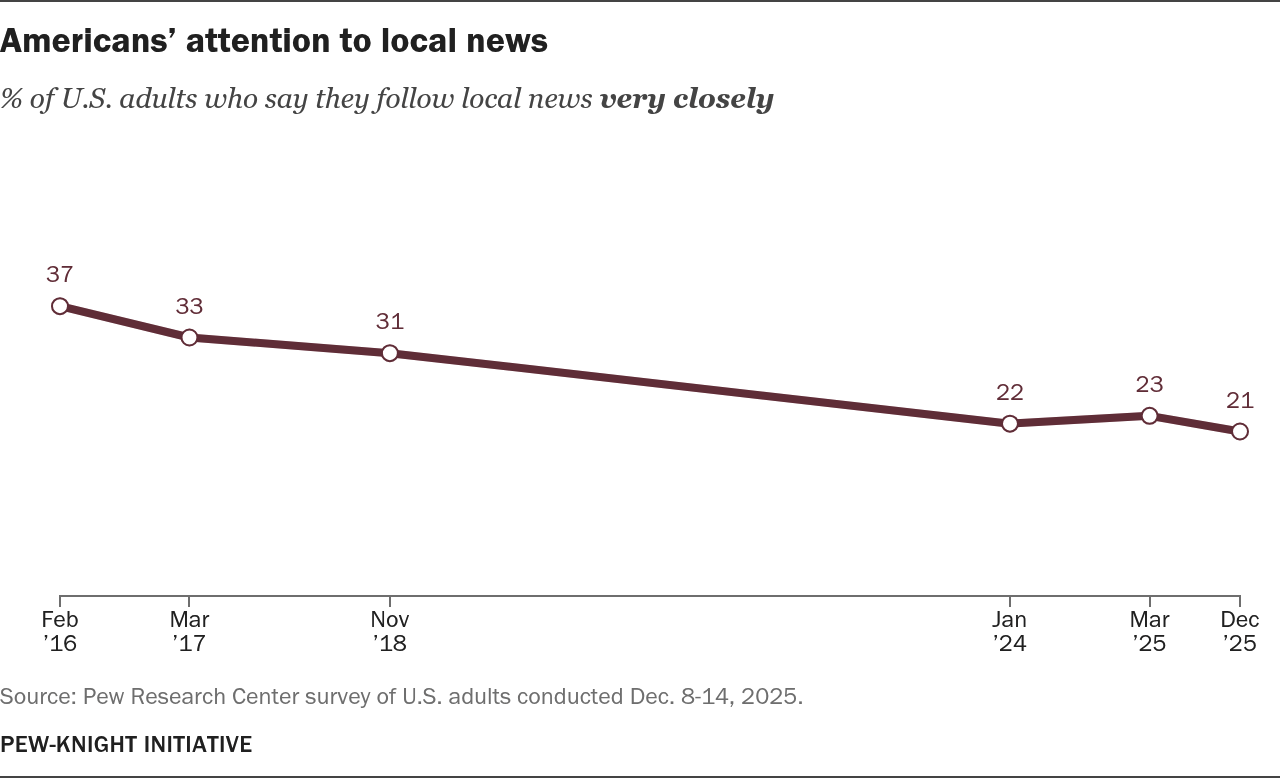
Attention to local news has declined since 2016, mirroring trends in attention to national news and news in general. In 2025, 21% of Americans say they follow local news very closely, down from 37% in 2016.
| Date | % |
|---|---|
| 2016-02-01 | 37% |
| 2017-03-01 | 33% |
| 2018-11-01 | 31% |
| 2024-01-01 | 22% |
| 2025-03-01 | 23% |
| 2025-12-01 | 21% |
Sources of local news
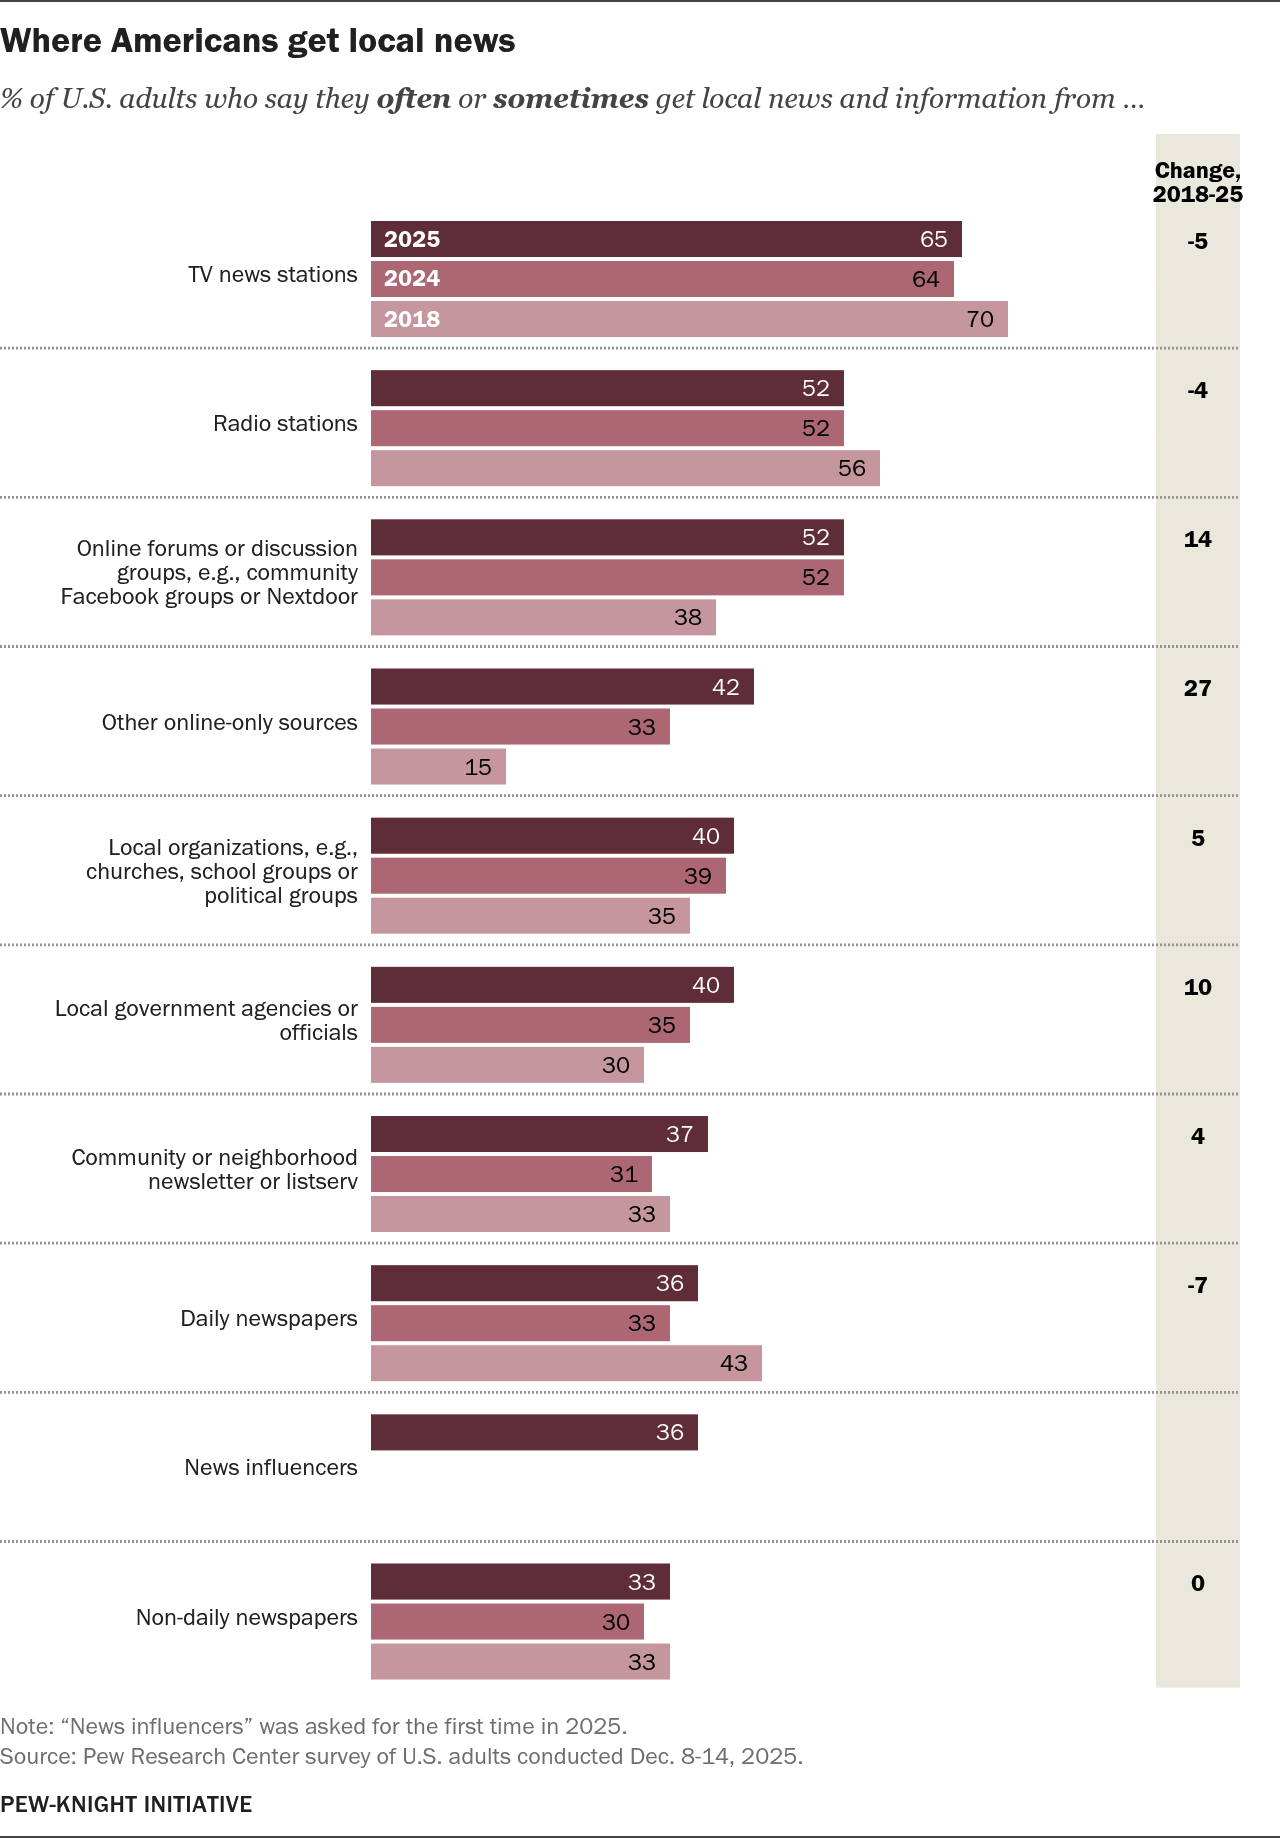
Americans turn to a range of sources for their local news, and while some traditional local news sources such as TV and radio remain common, growing numbers get local news in other ways.
About two-thirds of Americans (65%) say they at least sometimes get news from their local TV news station – down slightly from the 70% who said the same in 2018, though this remains one of the most popular sources of local news. Americans’ use of local newspapers is decreasing, too: 36% of U.S. adults say they get news from their local daily paper at least sometimes in 2025, compared with 43% in 2018.
Rising shares of Americans are getting local news at least sometimes from online forums or discussion groups (52%, up from 38% in 2018), as well as from local government agencies or officials (40%, up from 30%).
The sharpest growth in usage came from other online-only sources. As of 2025, 42% of U.S. adults say they get news at least sometimes from a source that publishes online only (and was not included in any of the other categories), more than double the share that used these sources in 2018 (15%).
| Group | Group | 2018 | 2024 | 2025 | Difference 2018-2025 |
|---|---|---|---|---|---|
| Daily newspapers | Local daily newspaper | 43% | 33% | 36% | -7 |
| TV news stations | Local TV news station | 70% | 64% | 65% | -5 |
| Radio stations | Local radio station | 56% | 52% | 52% | -4 |
| Non-daily newspapers | Other community or specialized newspaper (beyond the daily newspaper) | 33% | 30% | 33% | 0 |
| Community or neighborhood newsletter or listserv | Community or neighborhood newsletter or listserv | 33% | 31% | 37% | +4 |
| Local organizations, e.g., churches, school groups or political groups | Local organizations, such as churches, school groups, or political groups | 35% | 39% | 40% | +5 |
| Local government agencies or officials | Local government agencies or officials, such as city council offices or libraries | 30% | 35% | 40% | +10 |
| Online forums or discussion groups, e.g., community Facebook groups or Nextdoor | Local online forums or discussion groups, such as community Facebook groups or Nextdoor | 38% | 52% | 52% | +14 |
| Other online-only sources | A news source that publishes online only, and is not included in any of the previous categories | 15% | 33% | 42% | +27 |
| News influencers | Individuals who have a large following on social media and often post about news or political or social items, sometimes referred to as “news influencers” | NA | NA | 36% |
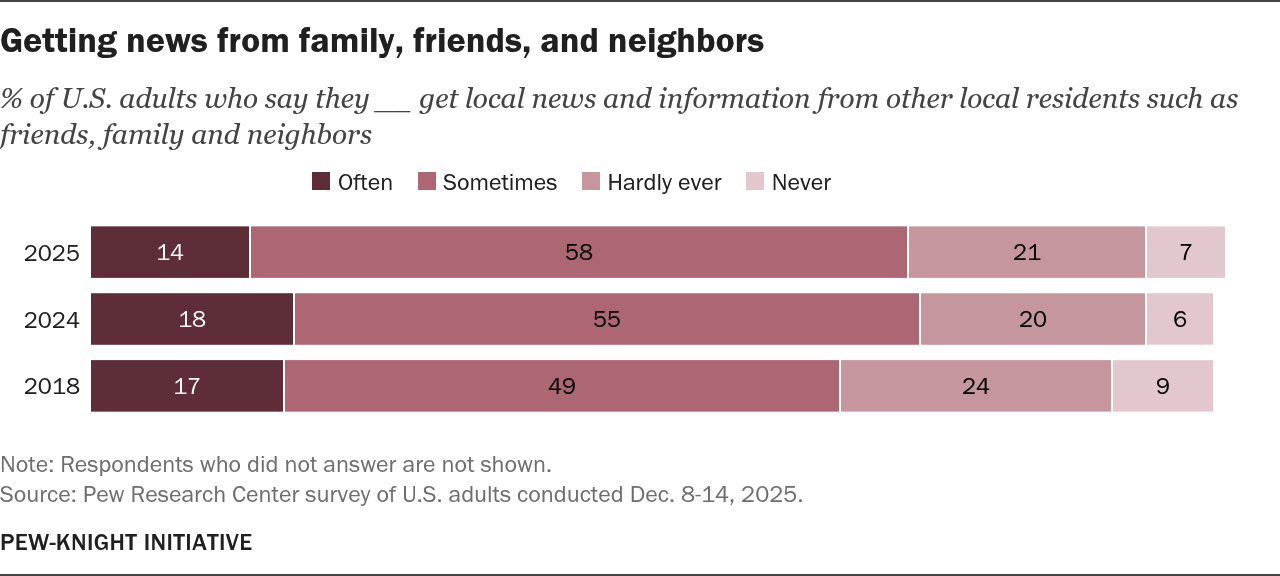
Many U.S. adults also get local news from people in their community, such as family, friends and neighbors. About three-quarters of Americans (72%) say they often or sometimes get news from other local residents, up slightly from the 66% who said the same in 2018.
A 2024 Pew Research Center study found that people who get news from other local residents most commonly do so by word of mouth.
| Year | NET Often/ Sometimes | Often | Sometimes | Hardly ever | Never |
|---|---|---|---|---|---|
| 2025 | 72% | 14% | 58% | 21% | 7% |
| 2024 | 73% | 18% | 55% | 20% | 6% |
| 2018 | 66% | 17% | 49% | 24% | 9% |
What platforms do Americans use for local news?
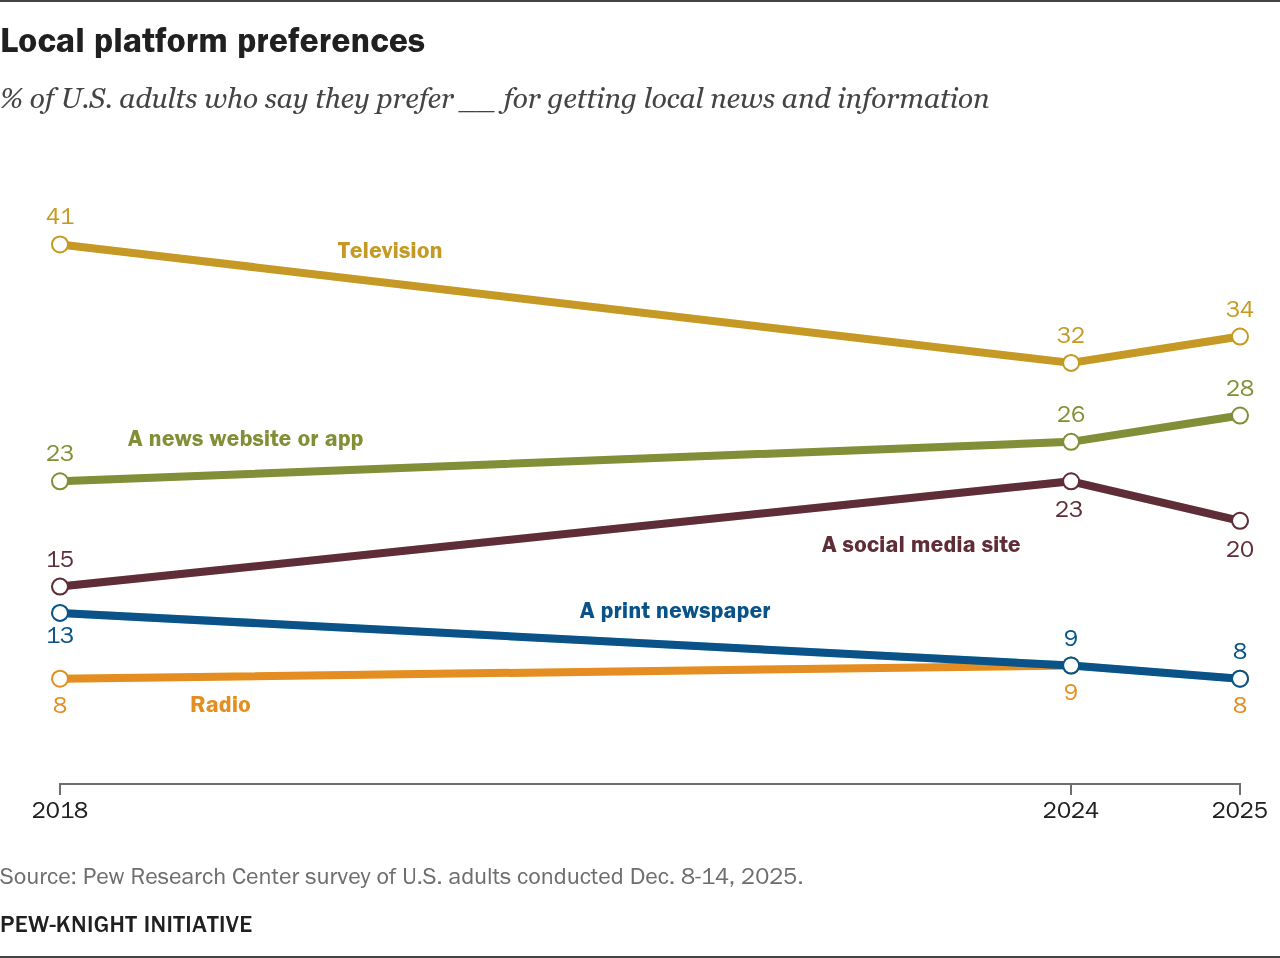
More U.S. adults still prefer television than any other pathway to local news, even though the share who express this preference has decreased from 41% in 2018 to 34% in 2025. Meanwhile, the share of U.S. adults who say they prefer social media sites and news websites or apps for local news has increased slightly since 2018.
| Year | A print newspaper | Radio | Television | A social media site | A news website or app |
|---|---|---|---|---|---|
| 2018 | 13% | 8% | 41% | 15% | 23% |
| 2024 | 9% | 9% | 32% | 23% | 26% |
| 2025 | 8% | 8% | 34% | 20% | 28% |
The proliferation of digital platforms as local news sources can be seen even in the way Americans now interact with traditional news outlets, like local TV news and local daily newspapers.
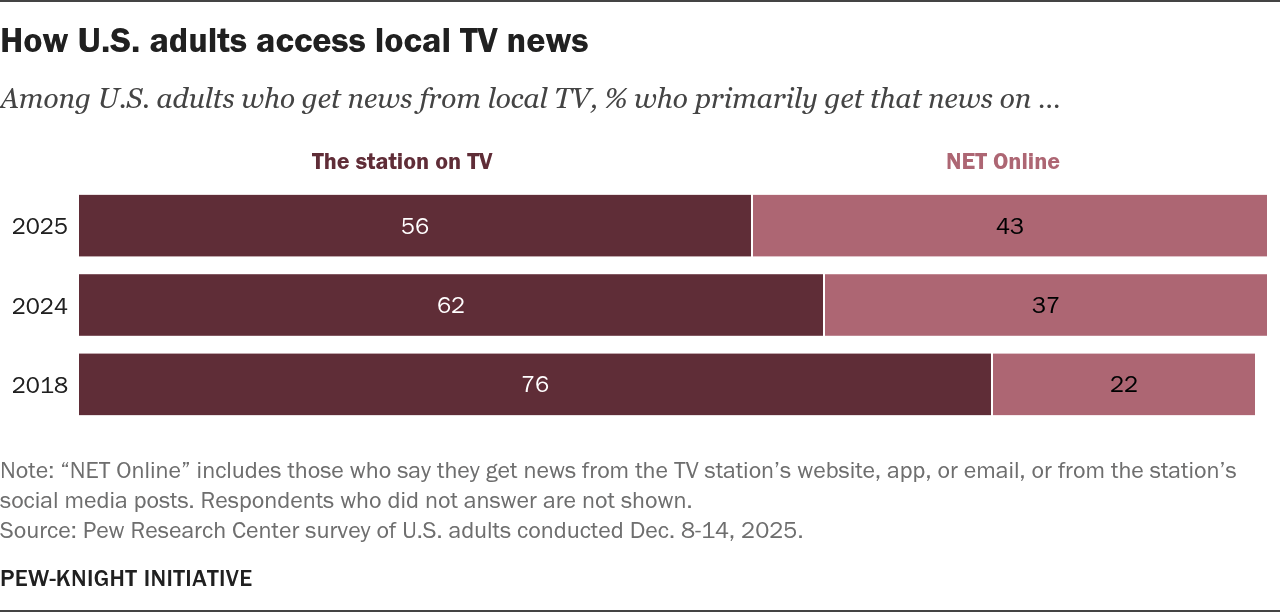
Slightly over half of those who say they get news from local TV (56%) say they primarily turn to a station on traditional television for that news, a decline since 2018, when 76% used a TV. The remaining 43% say they primarily get their local TV station’s news online, whether from the station’s website, app, emails or social media posts.
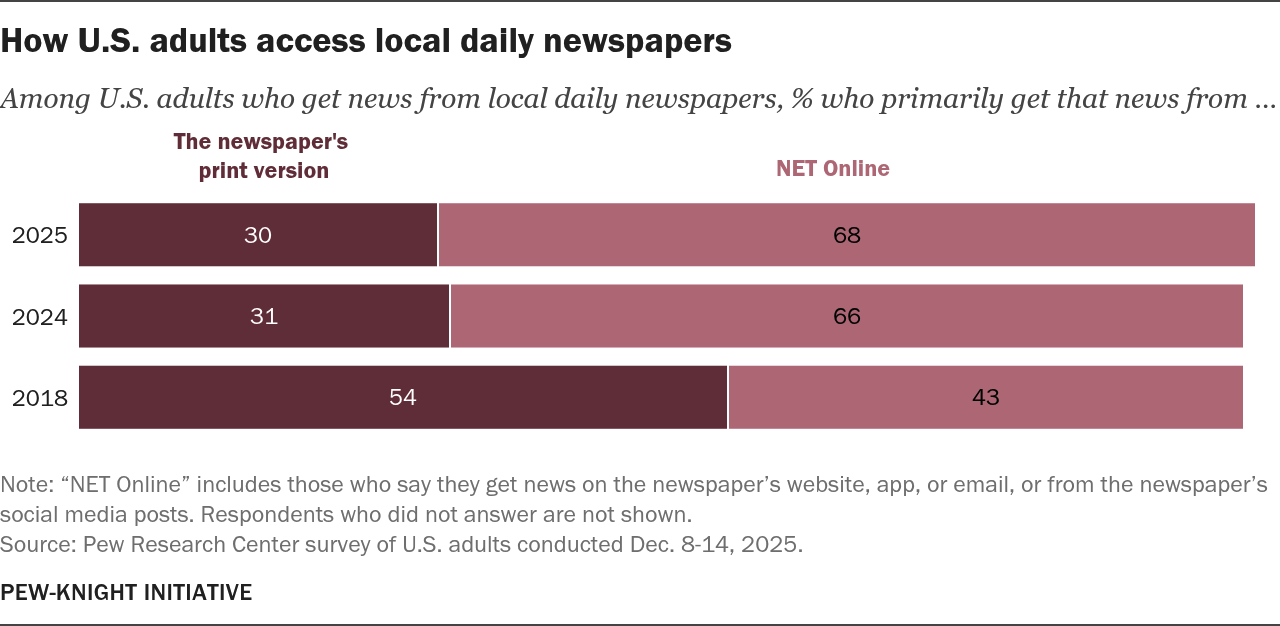
The way Americans get the news from their local newspapers has moved even further in a digital direction. About two-thirds of those who say they get news from local daily newspapers (68%) primarily get that news online, compared with 43% in 2018.
| Year | The station on TV | NET Online |
|---|---|---|
| 2025 | 56% | 43% |
| 2024 | 62% | 37% |
| 2018 | 76% | 22% |
| Year | The newspaper’s print version | NET Online |
|---|---|---|
| 2025 | 30% | 68% |
| 2024 | 31% | 66% |
| 2018 | 54% | 43% |
Paying for local news
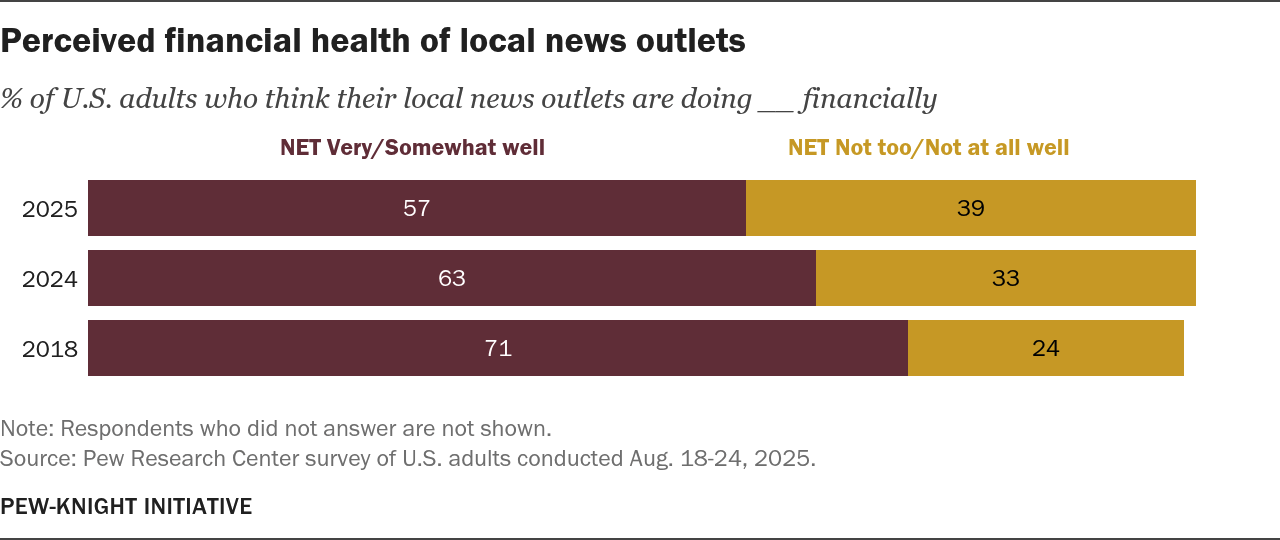
A majority of U.S. adults (57%) still say their local news outlets are doing at least somewhat well financially. But 39% say they are not doing well – up from 24% who said the same in 2018.
| Year | NET Very/Somewhat well | NET Not too/Not at all well |
|---|---|---|
| 2025 | 57% | 39% |
| 2024 | 63% | 33% |
| 2018 | 71% | 24% |
The vast majority of Americans (88%) say they have not paid or given money to any local news source in the past year, whether by subscribing, donating or becoming a member. Just 12% say they have done this.

| Year | Paid for local news | Not paid for local news |
|---|---|---|
| 2025 | 12% | 88% |
| 2024 | 15% | 85% |
| 2018 | 14% | 84% |
When those who have not paid for local news in the past year are asked why, half say the main reason they do not pay for local news is because they can find plenty of it for free. About three-in-ten (29%) say their main reason is that they’re not interested enough to pay for it. Another 10% say it’s too expensive, and 9% say that the news available to them is not good enough to pay for. These shares have largely stayed steady since 2018.

| Year | Can find plenty of free local news | Not interested enough in local news to pay for it | It’s too expensive | The news provided is not good enough to pay for |
|---|---|---|---|---|
| 2025 | 50% | 29% | 10% | 9% |
| 2024 | 49% | 30% | 8% | 10% |
| 2018 | 49% | 26% | 12% | 10% |
How important is local news?
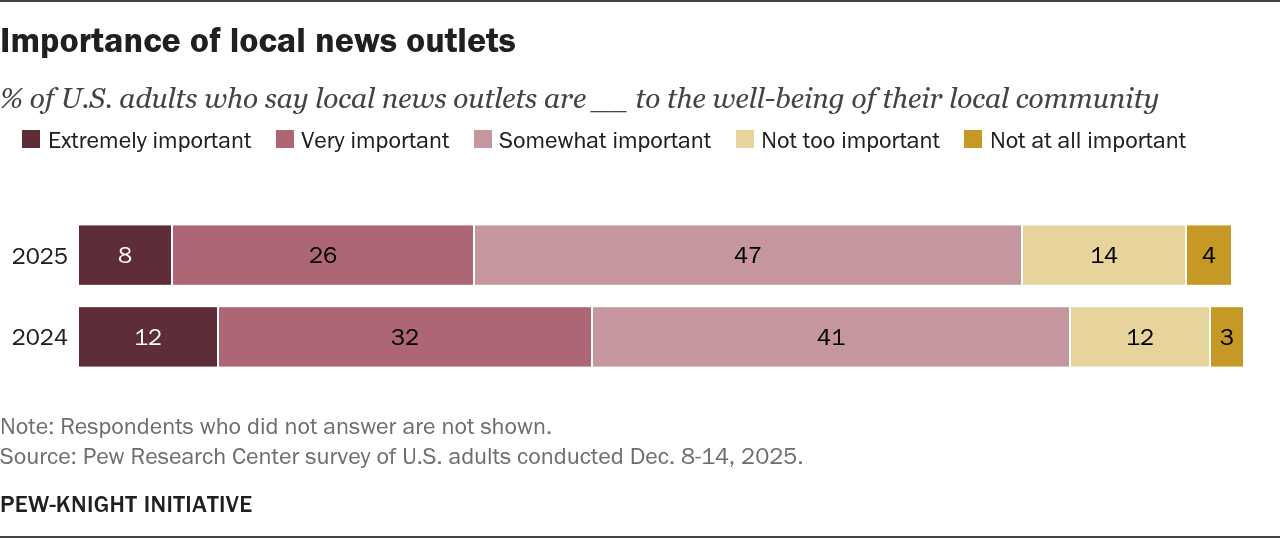
A large majority of U.S. adults (80%) say that local news outlets are at least somewhat important to the well-being of their local community. There has been a recent decline in the share of Americans who say their local news outlets are extremely or very important: 34% say this in 2025, compared with 44% who said the same a year prior.
| Year | Extremely important | Very important | Somewhat important | Not too important | Not at all important |
|---|---|---|---|---|---|
| 2024 | 12% | 32% | 41% | 12% | 3% |
| 2025 | 8% | 26% | 47% | 14% | 4% |
How many Americans have spoken with a local journalist?
About a quarter (23%) of Americans say they have ever spoken with a local journalist, roughly the same as the portion who said this in 2016. Americans with a college degree or more are more likely to have done this (30%) than those with a high school diploma or less (17%).
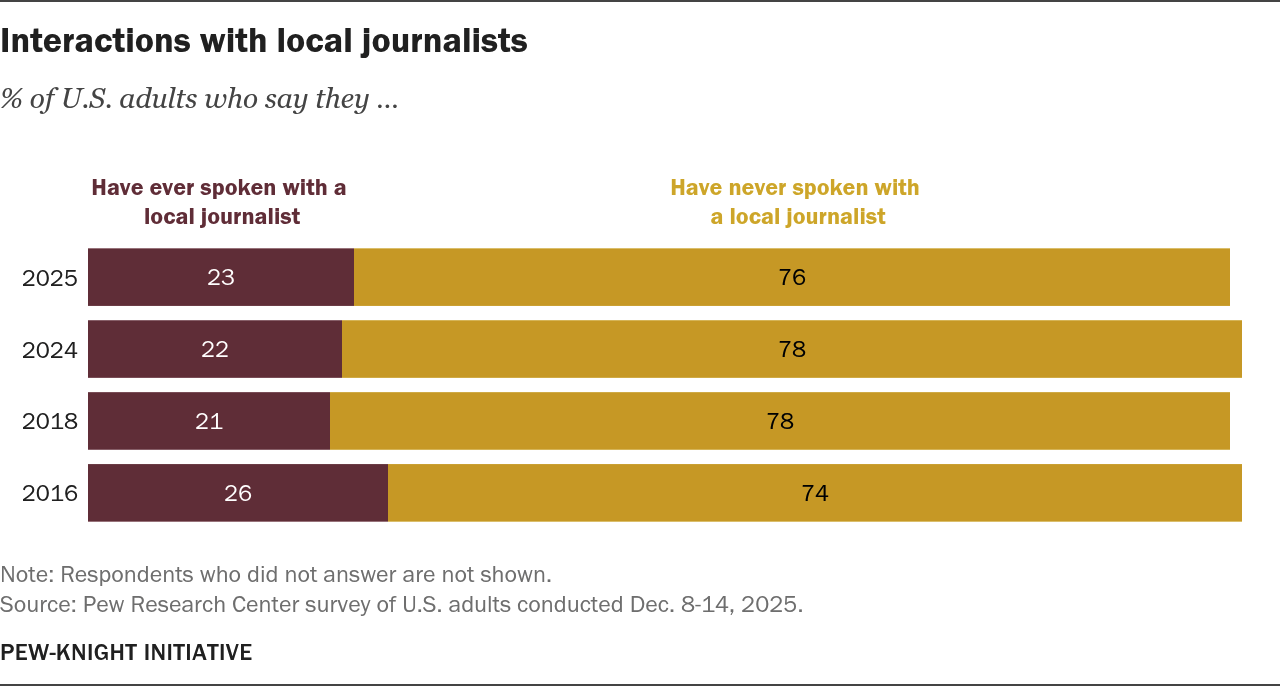
| Year | Have spoken with a local journalist | Have never spoken with a local journalist |
|---|---|---|
| 2025 | 23% | 76% |
| 2024 | 22% | 78% |
| 2018 | 21% | 78% |
| 2016 | 26% | 74% |
Local news behaviors and attitudes by demographics
Following local news by demographics
% of U.S. adults in each demographic group who say they follow local news very closely
| U.S. adults | 21% |
| Men | 21% |
| Women | 22% |
| Ages 18-29 | 15% |
| 30-49 | 17% |
| 50-64 | 23% |
| 65+ | 32% |
| HS or less | 25% |
| Some college | 19% |
| College+ | 20% |
| White | 20% |
| Black | 34% |
| Hispanic | 21% |
| Asian* | 14% |
| Rep/Lean Rep | 21% |
| Dem/Lean Dem | 22% |
* Estimates for Asian adults are representative of English speakers only.
Note: White, Black and Asian adults include those who report being only one race and are not Hispanic; Hispanic adults are of any race.
Source: Pew Research Center survey of U.S. adults conducted Dec. 8-14, 2025.
PEW-KNIGHT INITIATIVE
Local news platform use by demographics
% of U.S. adults in each demographic group who say they often or sometimes get local news and information from … (scroll to right for additional platforms)
| TV news stations | Radio stations | Online forums or groups, e.g., Facebook groups or Nextdoor | Other online-only sources | Local govt. agencies and officials | Local organizations, e.g., churches, school groups or political groups | Newsletters/Listservs | News influencers | Daily newspapers | Non-daily newspapers | |
|---|---|---|---|---|---|---|---|---|---|---|
| U.S. adults | 65% | 52% | 52% | 42% | 40% | 40% | 37% | 36% | 36% | 33% |
| Men | 63% | 51% | 46% | 43% | 36% | 37% | 33% | 33% | 35% | 31% |
| Women | 67% | 53% | 57% | 41% | 43% | 43% | 40% | 40% | 37% | 35% |
| Ages 18-29 | 48% | 36% | 54% | 48% | 38% | 37% | 31% | 51% | 29% | 31% |
| 30-49 | 60% | 54% | 60% | 47% | 43% | 40% | 38% | 45% | 36% | 34% |
| 50-64 | 74% | 61% | 49% | 42% | 39% | 38% | 38% | 29% | 35% | 33% |
| 65+ | 78% | 54% | 40% | 31% | 39% | 43% | 40% | 19% | 42% | 34% |
| HS or less | 70% | 55% | 50% | 38% | 38% | 40% | 36% | 39% | 35% | 32% |
| Some college | 67% | 54% | 57% | 45% | 41% | 40% | 36% | 38% | 35% | 33% |
| College+ | 58% | 47% | 48% | 45% | 42% | 39% | 39% | 32% | 37% | 34% |
| White | 64% | 51% | 51% | 40% | 38% | 38% | 35% | 31% | 35% | 33% |
| Black | 76% | 56% | 51% | 46% | 46% | 47% | 38% | 45% | 41% | 36% |
| Hispanic | 66% | 56% | 55% | 48% | 41% | 42% | 42% | 48% | 34% | 34% |
| Asian* | 59% | 44% | 46% | 42% | 43% | 32% | 38% | 40% | 37% | 33% |
| Rep/Lean Rep | 65% | 53% | 53% | 42% | 37% | 44% | 38% | 36% | 32% | 32% |
| Dem/Lean Dem | 65% | 51% | 51% | 44% | 44% | 37% | 37% | 37% | 40% | 35% |
* Estimates for Asian adults are representative of English speakers only.
Note: White, Black and Asian adults include those who report being only one race and are not Hispanic; Hispanic adults are of any race.
Source: Pew Research Center survey of U.S. adults conducted Dec. 8-14, 2025.
PEW-KNIGHT INITIATIVE
Local news platform preference by demographics
% of U.S. adults in each demographic group who say they prefer __ for getting local news and information (scroll to right for additional preferences)
| A print newspaper | Radio | Television | A social media site (such as Facebook or TikTok) | A news website or app | |
|---|---|---|---|---|---|
| U.S. adults | 8% | 8% | 34% | 20% | 28% |
| Men | 8% | 9% | 33% | 20% | 30% |
| Women | 9% | 7% | 36% | 21% | 25% |
| Ages 18-29 | 7% | 8% | 10% | 41% | 30% |
| 30-49 | 6% | 8% | 22% | 27% | 36% |
| 50-64 | 6% | 10% | 45% | 11% | 27% |
| 65+ | 14% | 8% | 60% | 3% | 14% |
| HS or less | 8% | 7% | 43% | 21% | 19% |
| Some college | 7% | 9% | 34% | 23% | 26% |
| College+ | 10% | 9% | 24% | 17% | 39% |
| White | 10% | 9% | 34% | 16% | 29% |
| Black | 4% | 6% | 40% | 25% | 23% |
| Hispanic | 4% | 7% | 34% | 28% | 25% |
| Asian* | 8% | 8% | 23% | 27% | 34% |
| Rep/Lean Rep | 9% | 10% | 35% | 20% | 25% |
| Dem/Lean Dem | 7% | 7% | 31% | 22% | 31% |
* Estimates for Asian adults are representative of English speakers only.
Note: White, Black and Asian adults include those who report being only one race and are not Hispanic; Hispanic adults are of any race.
Source: Pew Research Center survey of U.S. adults conducted Dec. 8-14, 2025.
PEW-KNIGHT INITIATIVE
Importance of local news by demographics
% of U.S. adults in each demographic group who say local news outlets are at least somewhat important to the well-being of their local community
| U.S. adults | 80% |
| Men | 79% |
| Women | 82% |
| Ages 18-29 | 77% |
| 30-49 | 80% |
| 50-64 | 81% |
| 65+ | 83% |
| HS or less | 77% |
| Some college | 83% |
| College+ | 82% |
| White | 80% |
| Black | 83% |
| Hispanic | 82% |
| Asian* | 84% |
| Rep/Lean Rep | 75% |
| Dem/Lean Dem | 86% |
* Estimates for Asian adults are representative of English speakers only.
Note: White, Black and Asian adults include those who report being only one race and are not Hispanic; Hispanic adults are of any race.
Source: Pew Research Center survey of U.S. adults conducted Dec. 8-14, 2025.
PEW-KNIGHT INITIATIVE
Paying for local news by demographics
% of U.S. adults who have paid for local news in the past year
| U.S. adults | 12% |
| Men | 11% |
| Women | 13% |
| Ages 18-29 | 11% |
| 30-49 | 9% |
| 50-64 | 9% |
| 65+ | 19% |
| HS or less | 9% |
| Some college | 9% |
| College+ | 17% |
| White | 13% |
| Black | 11% |
| Hispanic | 9% |
| Asian* | 12% |
| Rep/Lean Rep | 8% |
| Dem/Lean Dem | 17% |
* Estimates for Asian adults are representative of English speakers only.
Note: White, Black and Asian adults include those who report being only one race and are not Hispanic; Hispanic adults are of any race.
Source: Pew Research Center survey of U.S. adults conducted Aug. 18-24, 2025.
PEW-KNIGHT INITIATIVE
Find out more
This fact sheet was compiled by Research Analyst Naomi Forman-Katz, Research Assistant Joanne Haner and Senior Researcher Elisa Shearer. Associate Digital Producer Justine Coleman, Associate Director of Design and Production Peter Bell and Research Analyst Christopher St. Aubin also contributed.
Here are the questions used for this analysis, the topline and the survey methodology from the survey conducted in August 2025.
Here are the questions, topline and methodology from the survey conducted in December 2025.
Follow these links for related research:
- Americans’ Changing Relationship With Local News (May 7, 2024)
- News Platform Fact Sheet (Sept. 25, 2025)
- Social Media and News Fact Sheet (Sept. 25, 2025)
- News Influencers Fact Sheet (Nov. 4, 2025)
- Americans are following the news less closely than they used to (Dec. 3, 2025)
- News Media Tracker (June 10, 2025)
This is a Pew Research Center analysis from the Pew-Knight Initiative, a research program funded jointly by The Pew Charitable Trusts and the John S. and James L. Knight Foundation. Find related reports online at https://www.pewresearch.org/pew-knight/.