
This report is the culmination of a yearlong study into Americans’ trust and attitudes toward the news media. The main source of data for this report comes from a survey of 10,300 U.S. adults conducted Feb. 18 to March 2, 2020. The question about the influence of corporate and financial interests on the news comes from a survey of 13,200 U.S. adults conducted August 3-16, 2020. The report also draws on a series of 10 focus groups conducted in three different cities by Pew Research Center.
This report also relies on previously reported data and findings from the yearlong study, including a previously published report that looked at more than 50 different Pew Research Center surveys conducted across several years and a report that looked at Americans’ attitudes of the news media during the COVID-19 outbreak. It also uses data from other Center studies on news coverage of the outbreak and of the protests in the wake of the killing of George Floyd.
This report was made possible by The Pew Charitable Trusts, which received support from the John S. and James L. Knight Foundation.
The American Trends Panel survey methodology
The American Trends Panel (ATP), created by Pew Research Center, is a nationally representative panel of randomly selected U.S. adults. Panelists participate via self-administered web surveys. Panelists who do not have internet access at home are provided with a tablet and wireless internet connection. The panel is being managed by Ipsos.
Data in this report is drawn from the panel wave conducted Feb. 18 to March 2, 2020. A total of 10,300 panelists responded out of 11,036 who were sampled, for a response rate of 93%. This does not include six panelists who were removed from the data due to extremely high rates of refusal or straightlining. The cumulative response rate accounting for nonresponse to the recruitment surveys and attrition is 5%. The break-off rate among panelists who logged onto the survey and completed at least one item is 1.3%. The margin of sampling error for the full sample of 10,300 respondents is plus or minus 1.5 percentage points.
The subsample from the ATP consisted of 11,036 ATP members who responded to the Wave 57 survey and were still active.
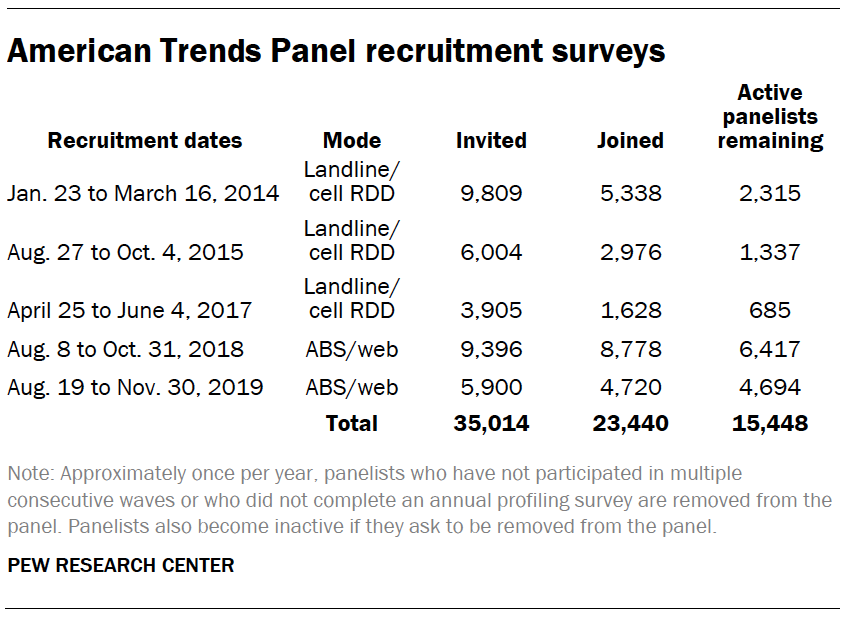
The ATP was created in 2014, with the first cohort of panelists invited to join the panel at the end of a large, national, landline and cellphone random-digit-dial survey that was conducted in both English and Spanish. Two additional recruitments were conducted using the same method in 2015 and 2017, respectively. Across these three surveys, a total of 19,718 adults were invited to join the ATP, of which 9,942 agreed to participate.
In August 2018, the ATP switched from telephone to address-based recruitment. Invitations were sent to a random, address-based sample (ABS) of households selected from the U.S. Postal Service’s Delivery Sequence File. In each household, the adult with the next birthday was asked to go online to complete a survey, at the end of which they were invited to join the panel. For a random half-sample of invitations, households without internet access were instructed to return a postcard. These households were contacted by telephone and sent a tablet if they agreed to participate. A total of 9,396 were invited to join the panel, and 8,778 agreed to join the panel and completed an initial profile survey. The same recruitment procedure was carried out on Aug. 19, 2019, from which a total of 5,900 were invited to join the panel and 4,720 agreed to join the panel and completed an initial profile survey. Of the 23,440 individuals who have ever joined the ATP, 15,448 remained active panelists and continued to receive survey invitations at the time this survey was conducted.
The U.S. Postal Service’s Delivery Sequence File has been estimated to cover as much as 98% of the population, although some studies suggest that the coverage could be in the low 90% range.8
Weighting
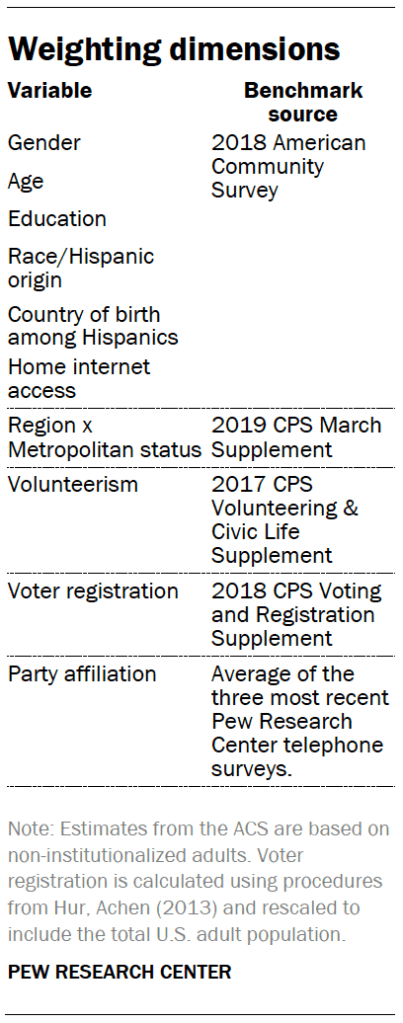
The ATP data was weighted in a multistep process that begins by calibrating the entire panel so that it aligns with the population benchmarks identified in the accompanying table to create a full-panel weight. For ATP waves in which only a subsample of panelists are invited to participate, a wave-specific base weight is created by adjusting the full-panel weights for subsampled panelists to account for any differential probabilities of selection for the particular panel wave. For waves in which all active panelists are invited to participate, the wave-specific base weight is identical to the full-panel weight. The next step in the weighting uses an iterative technique that aligns the sample to population benchmarks on the dimensions listed in the accompanying table.
Sampling errors and test of statistical significance take into account the effect of weighting. Interviews are conducted in both English and Spanish.
In addition to sampling error, one should bear in mind that question wording and practical difficulties in conducting surveys can introduce error or bias into the findings of opinion polls.
The following table shows the unweighted sample sizes and the error attributable to sampling that would be expected at the 95% level of confidence for different groups in the survey:
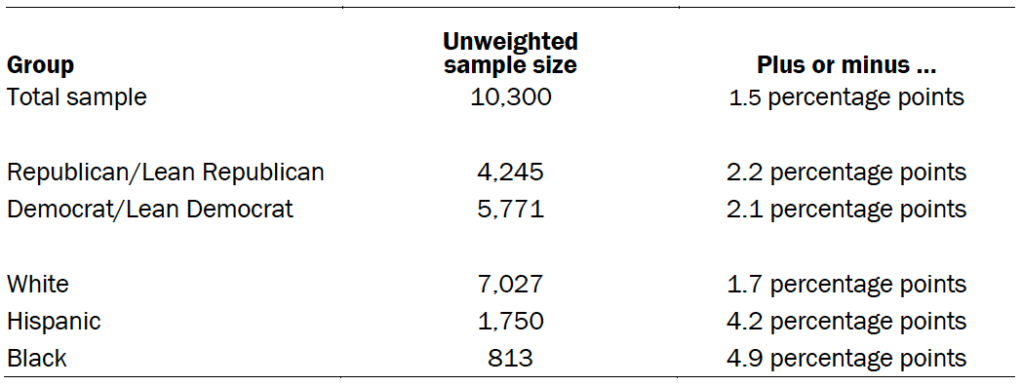
Sample sizes and sampling errors for other subgroups are available upon request.
One previously unreported survey question in this study comes from separate wave that was conducted August 3-16, 2020. A total of 13,200 panelists responded to that wave. The margin of sampling error for these 13,200 panelists is plus or minus 1.4 percentage points.
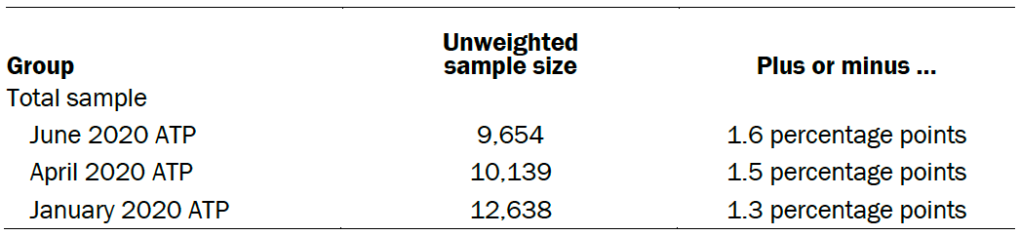
Finally, the analysis in this report also uses previously reported data from three other waves of the American Trends Panel (ATP), which were fielded during January, April and June 2020. For each, see the full methodologies for each of these three surveys below:
- American Trends Panel June 2020 survey methodology
- American Trends Panel April 2020 survey methodology
- American Trends Panel January 2020 survey methodology
Focus groups
Pew Research Center conducted a series of focus groups as part of a yearlong study exploring Americans’ views of the news media. Ten focus groups were held across the following three cities: Houston, Texas; St. Louis, Missouri; and Charlotte, North Carolina. These three cities were chosen because of their demographics and recommendations by our vendor.
The primary goal of these focus groups was to inform the development of the survey that was conducted Feb. 18-March 2, 2020, among U.S. adults who are part of the Center’s American Trends Panel. This survey was the main source of data for this report. The report includes a number of quotations from the focus groups to help illustrate and add nuance to the survey findings. Quotations are chosen to provide context and are not necessarily representative of the majority opinion in any particular group or city. Quotations may have been edited for grammar, spelling and clarity.
Each group consisted of six adults coming together for about an hour and a half for a discussion led by a professional moderator using a guide developed by Pew Research Center. Many of the groups were made up of people of one demographic characteristic. Beyond that demographic characteristic, each of the groups was recruited to have a mix of other characteristics and attitudes as appropriate, including gender, education, income, age, race or ethnicity, political party affiliation, urban and rural location, employment status and amount of trust in the news media. Finally, aside from one of the groups in St. Louis which focused on “less newsy” Americans, all groups required participants to follow the news at least some of the time. The 10 focus groups are the following:
Houston:
- Group 1, “General group” – Participants included a mix of demographic characteristics and attitudes toward the news media.
- Group 2, “Hispanic Americans” – Participants were selected based on whether they self-identified as either Hispanic or Latino.
St. Louis:
- Group 1, “General group” – Participants included a mix of demographic characteristics and attitudes toward the news media.
- Group 2, “Republicans” – Participants self-identified as Republican, consisted of a mix of those who identify as either “very” or “somewhat” conservative and included those who approve and disapprove of the job Donald Trump is doing as president.
- Group 3, “Less newsy” – Participants said they either follow the news “some of the time” or “only now and then” and that they follow news closely “only when something important is happening.”
- Group 4, “Highly newsy” – Participants said they follow the news “all or most of the time” and that they follow the news “most of the time, whether or not something important is happening.”
Charlotte:
- Group 1, “Democrats” – Participants self-identified as Democrats and consisted of a mix of those who identify as either “very” or “somewhat” liberal.
- Group 2, “African American” – Participants self-identified as either Black or African American.
- Group 3, “Older group” – Participants were between 48 and 74 years old.
- Group 4, “Younger group” – Participants were between 18 and 39 years old.
Focus groups were held in the following locations and on the following dates:
- Houston: Nov. 18, 2019
- Louis: Nov. 19-20, 2019
- Charlotte: Nov. 21, 2019
Ipsos Inc. worked with local field partners in each of the three cities to recruit the participants using a screener designed by Pew Research Center. All participants were given financial remuneration for their time.
© Pew Research Center, 2020
CORRECTION (September 2020): A previous version of this methodology statement contained an incorrect description of the base weighting for this survey. None of the study findings or conclusions are affected.
