The American Trends Panel survey methodology
Overview
The American Trends Panel (ATP), created by Pew Research Center, is a nationally representative panel of randomly selected U.S. adults. Panelists participate via self-administered web surveys. Panelists who do not have internet access at home are provided with a tablet and wireless internet connection. Interviews are conducted in both English and Spanish. The panel is being managed by Ipsos.
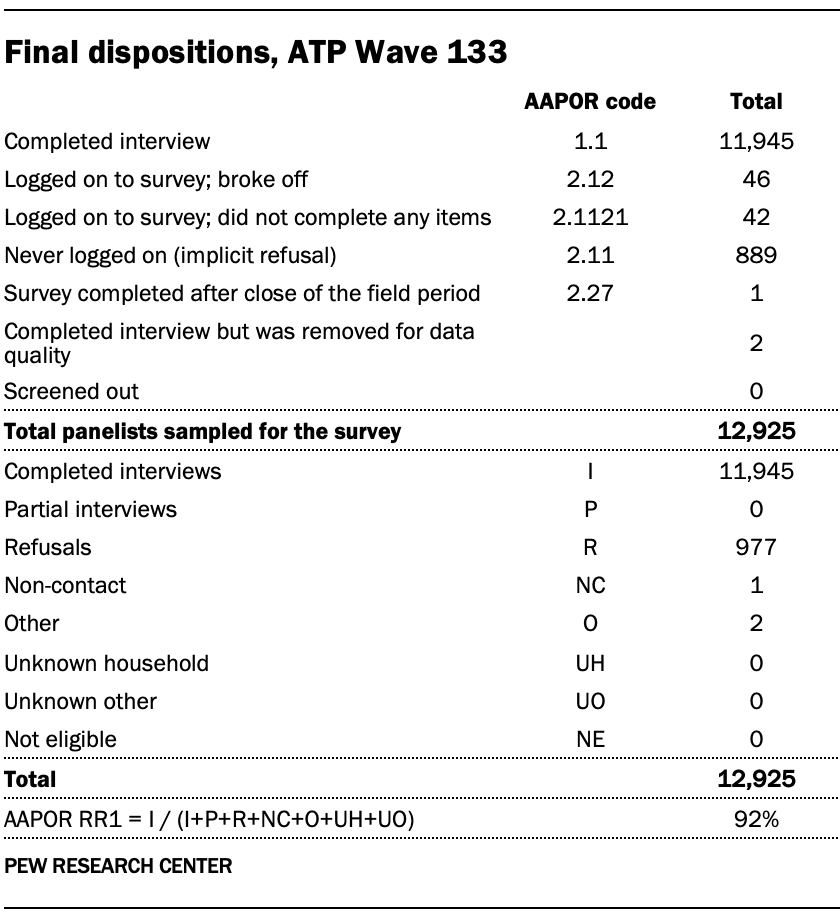
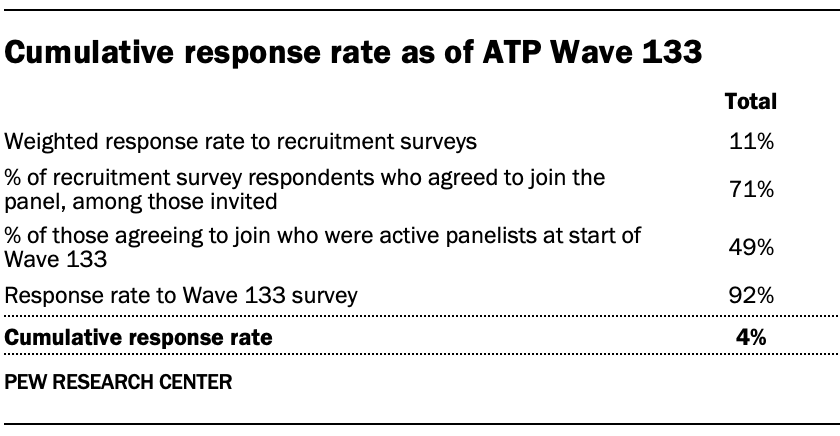
Data in this report is drawn from ATP Wave 133, conducted from Aug. 7 to Aug 27, 2023. A total of 11,945 panelists responded out of 12,925 who were sampled, for a response rate of 92%. The cumulative response rate accounting for nonresponse to the recruitment surveys and attrition is 4%. The break-off rate among panelists who logged on to the survey and completed at least one item is less than 1%. The margin of sampling error for the full sample of 11,945 respondents is plus or minus 1.4 percentage points.
Panel recruitment
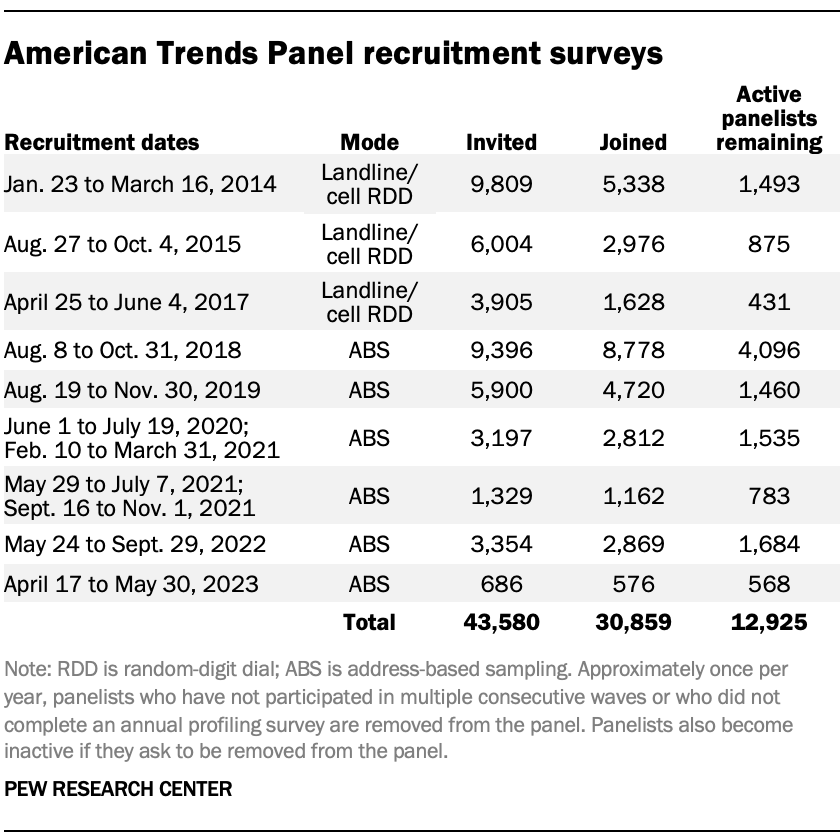
The ATP was created in 2014, with the first cohort of panelists invited to join the panel at the end of a large, national, landline and cellphone random-digit-dial survey that was conducted in both English and Spanish. Two additional recruitments were conducted using the same method in 2015 and 2017, respectively. Across these three surveys, a total of 19,718 adults were invited to join the ATP, of whom 9,942 (50%) agreed to participate.
In August 2018, the ATP switched from telephone to address-based sampling (ABS) recruitment. A study cover letter and a pre-incentive are mailed to a stratified, random sample of households selected from the U.S. Postal Service’s Delivery Sequence File. This Postal Service file has been estimated to cover as much as 98% of the population, although some studies suggest that the coverage could be in the low 90% range.3 Within each sampled household, the adult with the next birthday is asked to participate. Other details of the ABS recruitment protocol have changed over time but are available upon request.4
We have recruited a national sample of U.S. adults to the ATP approximately once per year since 2014. In some years, the recruitment has included additional effort (known as an “oversample”) to boost sample size with underrepresented groups. For example, Hispanic adults, Black adults and Asian adults were oversampled in 2019, 2022 and 2023, respectively.
Across the six address-based recruitments, a total of 23,862 adults were invited to join the ATP, of whom 20,917 agreed to join the panel and completed an initial profile survey. Of the 30,859 individuals who have ever joined the ATP, 12,925 remained active panelists and continued to receive survey invitations at the time this survey was conducted.
The American Trends Panel never uses breakout routers or chains that direct respondents to additional surveys.
Sample design
The overall target population for this survey was noninstitutionalized persons ages 18 and older living in the U.S., including Alaska and Hawaii. All active panel members were invited to participate in this wave.
Questionnaire development and testing
The questionnaire was developed by Pew Research Center in consultation with Ipsos. The web program was rigorously tested on both PC and mobile devices by the Ipsos project management team and Pew Research Center researchers. The Ipsos project management team also populated test data that was analyzed in SPSS to ensure the logic and randomizations were working as intended before launching the survey.
Incentives
All respondents were offered a post-paid incentive for their participation. Respondents could choose to receive the post-paid incentive in the form of a check or a gift code to Amazon.com or could choose to decline the incentive. Incentive amounts ranged from $5 to $20 depending on whether the respondent belongs to a part of the population that is harder or easier to reach. Differential incentive amounts were designed to increase panel survey participation among groups that traditionally have low survey response propensities.
Data collection protocol
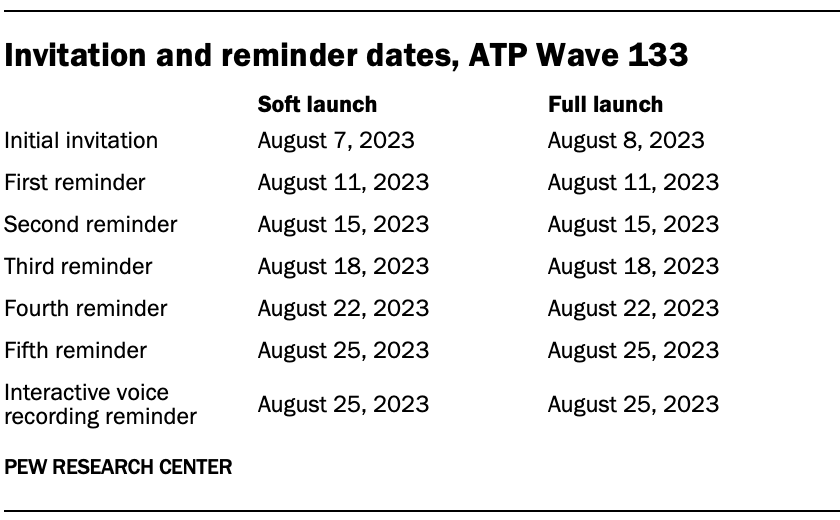
The data collection field period for this survey was Aug. 7 to Aug. 27, 2023. Postcard notifications were mailed to all ATP panelists with a known residential address on Aug. 7.
Invitations were sent out in two separate launches: soft launch and full launch. Ninety panelists were included in the soft launch, which began with an initial invitation sent on Aug. 7. The ATP panelists chosen for the initial soft launch were known responders who had completed previous ATP surveys within one day of receiving their invitation. All remaining English- and Spanish-speaking sampled panelists were included in the full launch and were sent an invitation on Aug. 8. All panelists with an email address received an email invitation and up to five email reminders if they did not respond to the survey. All ATP panelists who consented to SMS messages received an SMS invitation and up to five SMS reminders. On Aug. 25, interactive voice recording reminder calls were made to 39 tablet households that previously provided consent to receive these reminders.
Data quality checks
To ensure high-quality data, the Center’s researchers performed data quality checks to identify any respondents showing clear patterns of satisficing. This includes checking for very high rates of leaving questions blank, as well as always selecting the first or last answer presented. As a result of this checking, two ATP respondents were removed from the survey dataset prior to weighting and analysis.
Weighting
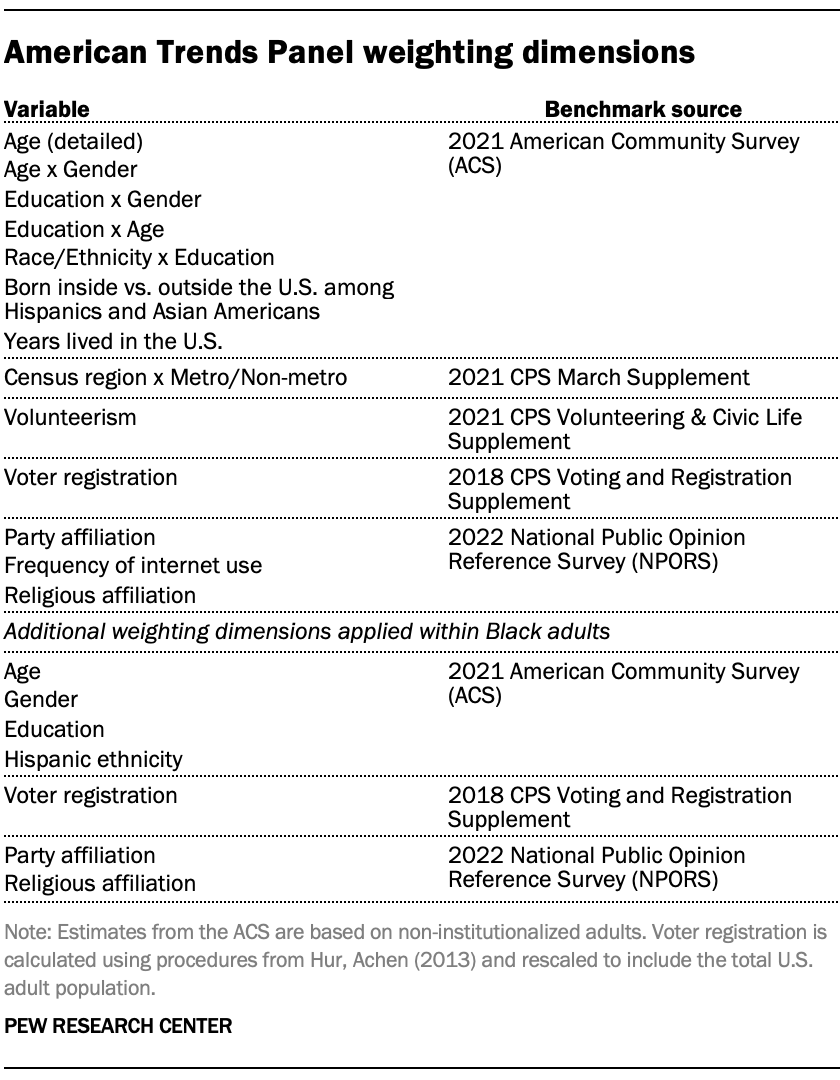
The ATP data is weighted in a multistep process that accounts for multiple stages of sampling and nonresponse that occur at different points in the survey process. First, each panelist begins with a base weight that reflects their probability of selection for their initial recruitment survey. These weights are then rescaled and adjusted to account for changes in the design of ATP recruitment surveys from year to year. Finally, the weights are calibrated to align with the population benchmarks in the accompanying table to correct for nonresponse to recruitment surveys and panel attrition. If only a subsample of panelists was invited to participate in the wave, this weight is adjusted to account for any differential probabilities of selection.
Among the panelists who completed the survey, this weight is then calibrated again to align with the population benchmarks identified in the accompanying table and trimmed at the 1st and 99.5th percentiles to reduce the loss in precision stemming from variance in the weights. Sampling errors and tests of statistical significance take into account the effect of weighting.
Dispositions and response rates
Analysis of TikTok behavioral data
The analysis of TikTok users’ behaviors and activities on the platform is based on a subsample of 869 respondents to the main survey who said they use TikTok, agreed to share their TikTok handle for research purposes and provided a valid handle when asked. Researchers from the Center used these handles to collect information about respondents’ on-platform behaviors using automated web scraping.
Of the 11,945 panelists who completed the ATP Wave 133 survey, 2,745 said they use TikTok. These respondents were asked if they would be willing to share their account username with us for this study, and 996 agreed. After the survey was fielded, researchers reviewed each provided account individually and removed accounts that were suspended, invalid, or belonged to institutions, products or international entities. The analysis of TikTok behavioral data in this report is based on a total of 869 respondents who completed the survey and provided both consent and a verifiable TikTok handle.
This final sample of 869 U.S. adult TikTok users with valid, active usernames was weighted using an iterative technique that aligns its composition with that of all TikTok users on American Trends Panel Wave 133. The sample was weighted on the following dimensions: gender, age, race, years lived in the U.S., education, region, party identification, volunteerism, voter registration, metropolitan area, religious affiliation, frequency of internet use, and how interesting they find the videos on their TikTok “For You” page. The margin of error for the full sample is plus or minus 5.8 percentage points.
The following table shows the unweighted sample sizes and the error attributable to sampling that would be expected at the 95% level of confidence for different groups in the survey.
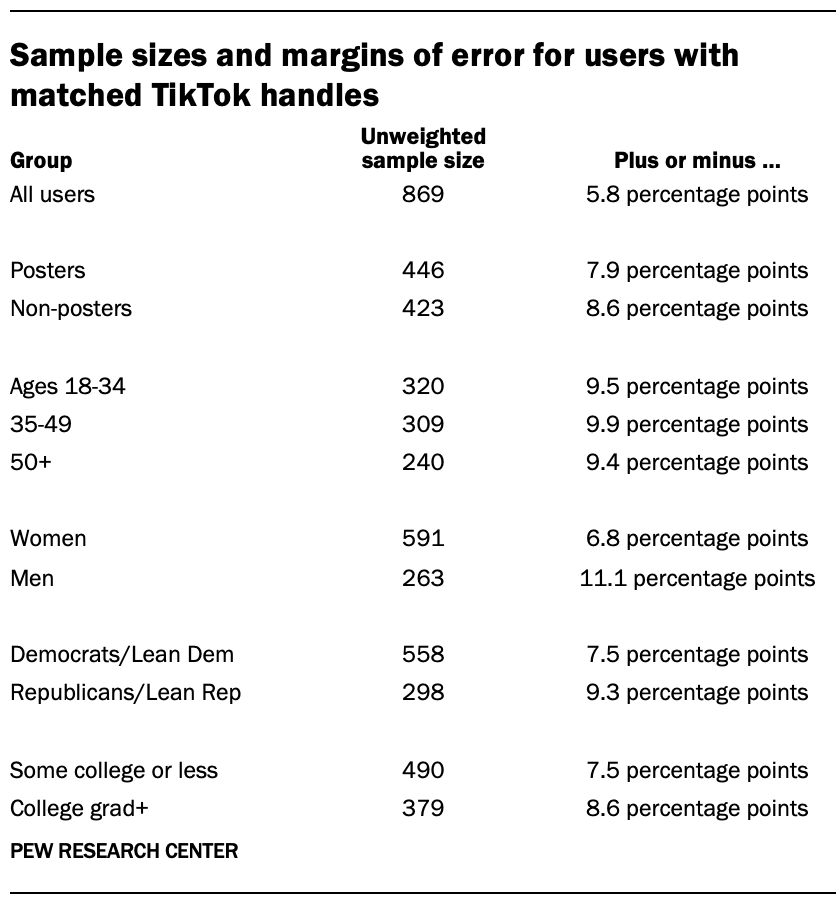
Sample sizes and sampling errors for other subgroups are available upon request. In addition to sampling error, one should bear in mind that question wording and practical difficulties in conducting surveys can introduce error or bias into the findings of opinion polls.
How this report defines TikTok posters and measures posting volume
This report uses two slightly different approaches to measure the volume of content users produce on TikTok due to the specific characteristics of TikTok’s privacy settings. TikTok is similar to many other social media platforms in that posts and profiles can either be publicly listed or set to private. However, TikTok profiles are unusual in that they have a total “like” count that tallies up all likes on all videos, including private ones. In cases where a user has posted private videos that have received likes, it’s possible for researchers to observe those likes even if they can’t see the videos themselves.
For findings in this report that deal with whether or not a user has “ever posted” on TikTok, we treat the presence of publicly visible videos or any account-level likes as evidence of posting behavior.
For findings in which the volume of posts produced by a given user is referenced, we are only referring to publicly visible videos, as there is no method available to count private videos, even if the total number of likes is visible.
Question wording and respondent consent language for collection of TikTok handles
Respondents were asked to provide their Twitter handles for research purposes using the following language:
In many of our surveys, we ask about how people like you use social media. But there’s a lot we cannot learn unless you allow us to connect information about your public TikTok behavior to your answers (even if you never post anything).
No matter how often you visit TikTok, would you be willing to share your TikTok username to help us with this research?
1. Yes
2. No
This project will ONLY collect information that an ordinary user would see when they visit your profile (see here [POPUP] for more details). We will treat this data just like we treat your survey responses and will NEVER share anything that can be linked back to you.
[POPUP] How we will use your TikTok username
If you provide us with your TikTok username, we will only be able to collect what an ordinary user would see when visiting your profile. The specific information we will have access to depends on the privacy settings of your TikTok account.
If your account is set to PUBLIC, we will be able to see the public videos you have posted and basic information in your profile, such as your bio. Depending on your specific privacy settings, we may also be able to see the accounts you follow as well as the accounts that follow you; the comments you have posted on other videos; and the videos from other users you have liked. We will NOT have access to any private messages you have sent or received, nor will we have access to the content of your “For You” page or your watch history.
If your account is set to PRIVATE, we will be able to see basic information in your profile, such as your bio and how many accounts you follow and how many follow you – but will NOT be able to see any of the content you have posted.
We expect that this research will be concluded in approximately 18 months. At that point we will ask you again whether or not you would like to provide your username. If you provided your TikTok username to us previously, that is why you are seeing this question again.
If at any point you wish to opt out of research related to your TikTok account, contact info@americantrendspanel.org. For more information about our privacy practices, please see our Privacy Policy.
Measuring TikTok adoption
Figures in this report on the share of U.S. adults who use TikTok are drawn from the National Public Opinion Reference Survey (NPORS). Ipsos conducted the NPORS for Pew Research Center using address-based sampling and a multimode protocol.
The survey was fielded from May 19 to Sept. 5, 2023. Participants were first mailed an invitation to complete an online survey. A paper survey was later mailed to those who did not respond. In total, 2,217 respondents completed the survey online, and 3,516 respondents completed the paper survey (total n=5,733). The survey was administered in English and Spanish. The AAPOR Response Rate 1 was 31%. The full methodology for NPORS (including margin of error) can be found here.