Focus Groups
In collaboration with the Berkman Center for Internet & Society at Harvard, this report includes quotes gathered through a series of exploratory in-person focus group interviews about privacy and digital media, with a focus on social media sites, conducted by the Berkman Center’s Youth and Media Project between February and April 2013. The team conducted 24 focus group interviews with a total of 156 participants across the greater Boston area, Los Angeles, Santa Barbara (California), and Greensboro (North Carolina) beginning in February 2013. Each focus group interview lasted 90 minutes, including a 15-minute questionnaire completed prior to starting the interview, consisting of 20 multiple-choice questions and 1 open-ended response.
Although the research sample was not designed to constitute representative cross-sections of particular population(s), the sample includes participants from diverse ethnic, racial and economic backgrounds. Participants ranged in age from 11 to 19. The mean age of participants is 14.5. Groups of three to eight participants were divided into age cohorts of 11-14, 14-16, and 16-19 for interviews. Females comprised 55% of participants, males 41%, and 4% chose not to reply. Half of the focus group participants (50%) were Hispanic, Latino, or of Spanish origin; 33% were white; 13% were black or African-American; 2% were Asian or Asian-American; 1% were American Indian or Alaskan Native; and 1% self-identified as other. Although we tried to assess participants’ socioeconomic status based on self-identification of their parents’ highest educational achievement, too many participants indicated uncertainty or no knowledge of this to allow for confidence in this metric. However, as we recruited from schools serving students primarily of lower socio-economic status in Los Angeles and Boston, we estimate that at least half of our sample draws from underserved populations.
In addition, two online focus groups of teenagers ages 12-17 were conducted by the Pew Internet Project from June 20-27th, 2012 to help inform the survey design. The first group was with 11 middle schoolers ages 12-14, and the second group was with 9 high schoolers ages 14-17. Each group was mixed gender, with some racial, socio-economic and regional diversity. The groups were conducted as an asynchronous threaded discussion over three days using the Qualboard platform and the participants were asked to log in twice per day. All references to these findings are referred to as “online focus groups” throughout the report.
2012 Teens and Privacy Management Survey
Prepared by Princeton Survey Research Associates International for the Pew Research Center’s Internet and American Life Project
October 2012
SUMMARY
The 2012 Teens and Privacy Management Survey sponsored by the Pew Research Center’s Internet and American Life Project obtained telephone interviews with a nationally representative sample of 802 teens aged 12 to 17 years-old and their parents living in the United States. The survey was conducted by Princeton Survey Research Associates International. The interviews were done in English and Spanish by Princeton Data Source, LLC from July 26 to September 30, 2012. Statistical results are weighted to correct known demographic discrepancies. The margin of sampling error for the complete set of weighted data is ±4.5 percentage points.
The Berkman Center at Harvard Law School lead the qualitative data collection effort for this project. Berkman staff (sometimes jointly with the Internet Project) conducted 24 focus group interviews with a total of 137 participants across the greater Boston area, Los Angeles, Santa Barbara, and Greensboro, North Carolina beginning in February 2013. Each focus group interview lasted 90 minutes, including a 15-minute questionnaire completed prior to starting the interview, consisting of 20 multiple-choice questions and 1 open-ended response.
Although the research sample was not designed to constitute representative cross-sections of particular population(s), the sample includes participants from diverse ethnic, racial and economic backgrounds. Participants ranged in age from 11 to 19. The mean age of participants is 14.8. Groups of three to eight participants were divided into age cohorts of 11-14, 14-16, and 16-19 for interviews. Females comprised 58% of participants and males 42%. A majority of participants (54%) were Hispanic, Latino, or of Spanish origin. Of the participants not of Hispanic, Latino or Spanish origin, 66% were white, 27% were African-American or African-American, 2% were Asian or Asian-American, 2% were American Indian or Alaskan Native, 2% self-identified as other, and 1% left the question unanswered. Although we tried to assess participants’ socioeconomic status based on self-identification of their parents’ highest educational achievement, too many participants indicated uncertainty or no knowledge of this to allow for confidence in this metric. However, as we recruited from schools serving students primarily of lower socio-economic status in Los Angeles and Boston, we estimate that at least half of our sample draws from underserved populations.
Details on the design, execution and analysis of the survey are discussed below.
Design and Data Collection Procedures
Sample Design
A combination of landline and cellular random digit dial (RDD) samples was used to represent all teens and their parents in the United States who have access to either a landline or cellular telephone. Both samples were provided by Survey Sampling International, LLC (SSI) according to PSRAI specifications.
Both samples were disproportionately stratified to increase the incidence of African Americans and Latinos. The same stratification scheme was used for both sample frames and was based on the estimated incidence of minority groups at the county level. All counties in the United States were divided into ten strata based on the estimated proportion of African American and Latino populations. Strata with higher minority densities were oversampled relative to strata with lower densities. Phone numbers were drawn with equal probabilities within strata. The disproportionate sample design was accounted for in the weighting.
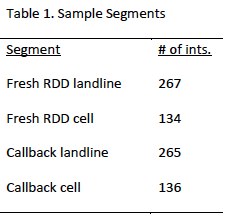
To supplement the fresh RDD sample, interviews were also completed among a sample of parents who recently participated in the PSRAI Weekly Omnibus survey. Table 1 shows a breakdown of the number of interviews completed by sample segment.
Contact Procedures
Interviews were conducted from July 26 to September 30, 2012. As many as 7 attempts were made to contact and interview a parent at every sampled landline telephone number and as many as five attempts were made to contact and interview a parent at every sampled cell number. After the parent interview, an additional 10 calls were made to interview an eligible teen. Sample was released for interviewing in replicates, which are representative subsamples of the larger sample. Using replicates to control the release of sample ensures that complete call procedures are followed for the entire sample. Calls were staggered over times of day and days of the week to maximize the chance of making contact with potential respondents. Each telephone number received at least one daytime call in an attempt to complete an interview.
Contact procedures were slightly different for the landline and cell samples. For the landline samples, interviewers first determined if the household had any 12 to 17 year-old residents. Households with no teens were screened-out as ineligible. In eligible households, interviewers first conducted a short parent interview with either the father/male guardian or mother/female guardian. The short parent interview asked some basic household demographic questions as well as questions about a particular teen in the household (selected at random if more than one teen lived in the house.)
For the cell phone samples, interviews first made sure that respondents were in a safe place to talk and that they were speaking with an adult. Calls made to minors were screened-out as ineligible. If the person was not in a safe place to talk a callback was scheduled. Interviewers then asked if any 12 to 17 year-olds lived in their household. Cases where no teens lived in the household were screened-out as ineligible. If there was an age-eligible teen in the household, the interviewers asked if the person on the cell phone was a parent of the child. Those who were parents went on to complete the parent interview. Those who were not parents were screened-out as ineligible.
For all samples, after the parent interview was complete an interview was completed with the target child. Data was kept only if the child interview was completed.
Weighting and analysis
Weighting is generally used in survey analysis to compensate for patterns of nonresponse and disproportionate sample designs that might bias survey estimates. This sample was weighted in three stages. The first stage of weighting corrected for the disproportionate RDD sample designs. For each stratum the variable WT1 was computed as the ratio of the size of the sample frame in the stratum divided by the amount of sample ordered in the stratum. For the callback samples, the weights from the original surveys was brought in and used as WT1.
The second stage of weighting involved correcting for different probabilities of selection based on respondents’ phone use patterns. Respondents who have both a landline and a cell phone have a greater chance of being sampled than respondents with access to only one kind of phone. To correct for this we computed a variable called PUA (Phone Use Adjustment). The PUA was computed using the following formula where n1 is the number of respondents having only one kind of phone (landline or cell, but not both) and n2 is the number of respondents have both a landline and a cell phone.

WT1 and PUA were then multiplied together to use as an input weight (WT2) for post-stratification raking
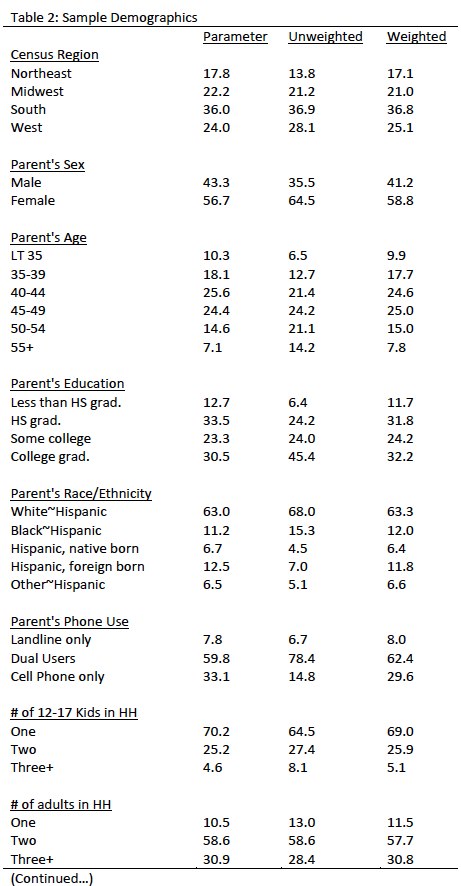
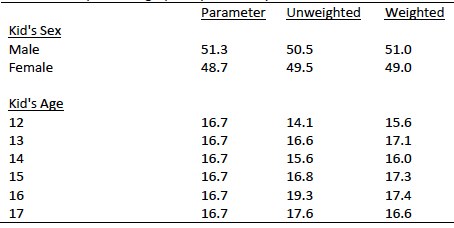
The interviewed sample was raked to match national parameters for both parent and child demographics. The parent demographics used for weighting were: sex; age; education; race; Hispanic origin; number of 12-17 year olds in household; number of adults in the household; phone use and region (U.S. Census definitions). The child demographics used for weighting were gender and age. The parameters came from a special analysis of the Census Bureau’s 2011 Annual Social and Economic Supplement (ASEC) that included all households in the United States. The phone use parameter was derived from recent PSRAI survey data.
Raking was accomplished using Sample Balancing, a special iterative sample weighting program that simultaneously balances the distributions of all variables using a statistical technique called the Deming Algorithm. Weights were trimmed to prevent individual interviews from having too much influence on the final results. The use of these weights in statistical analysis ensures that the demographic characteristics of the sample closely approximate the demographic characteristics of the national population. Table 2 compares weighted and unweighted sample distributions to population parameters.
Effects of Sample Design on Statistical Inference
Post-data collection statistical adjustments require analysis procedures that reflect departures from simple random sampling. PSRAI calculates the effects of these design features so that an appropriate adjustment can be incorporated into tests of statistical significance when using these data. The so-called “design effect” or deff represents the loss in statistical efficiency that results from systematic non-response. The total sample design effect for this survey is 1.69.
PSRAI calculates the composite design effect for a sample of size n, with each case having a weight, wi as:

In a wide range of situations, the adjusted standard error of a statistic should be calculated by multiplying the usual formula by the square root of the design effect (√deff ). Thus, the formula for computing the 95% confidence interval around a percentage is:

where p is the sample estimate and n is the unweighted number of sample cases in the group being considered.
The survey’s margin of error is the largest 95% confidence interval for any estimated proportion based on the total sample— the one around 50%. For example, the margin of error for the entire sample is ±4.5 percentage points. This means that in 95 out every 100 samples drawn using the same methodology, estimated proportions based on the entire sample will be no more than 4.5 percentage points away from their true values in the population. It is important to remember that sampling fluctuations are only one possible source of error in a survey estimate. Other sources, such as respondent selection bias, questionnaire wording and reporting inaccuracy, may contribute additional error of greater or lesser magnitude.
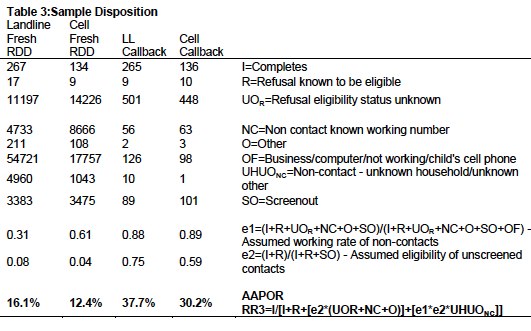
Response Rate
Table 3 reports the disposition of all sampled callback telephone numbers ever dialed. The response rate is calculated according to American Association of Public Opinion Research standards.