All data reported here are based on a survey of a sample of arts organizations conducted by the Pew Research Center’s Internet & American Life Project from May 30–July 20, 2012. Pew Internet staff developed the 30-minute online survey to study how arts organizations are currently using the internet, social media, and other digital technologies to share content, communicate with patrons, and manage their organizational objectives. At several points during survey development, Pew Internet solicited input from a diverse group of 11 experts in the arts field, who provided feedback on survey content, focus and language. This advisory group included local, state and national organization leaders, those working in the nonprofit arts sector, as well as researchers and practitioners in the field. Their input was invaluable in shaping a survey that captured the experiences of a wide range of arts organizations serving many missions in many different disciplines.
Survey sample
The survey results reported here are based on a national, non-probability sample of 1,258 arts organizations. The sample is not a probability sample of all arts organizations currently operating in the U.S. because it was not practical to assemble a sampling frame of this population. Instead, Pew Internet submitted a Freedom of Information Act (FOIA) request to the National Endowment for the Arts (NEA) to obtain the list of all arts organizations that received grants from the NEA during the 2006-2011 time period. The NEA provided a list of 5,773 grantees, which included the applying grantee’s name, their organization, mailing address and email address.
Contact Procedures
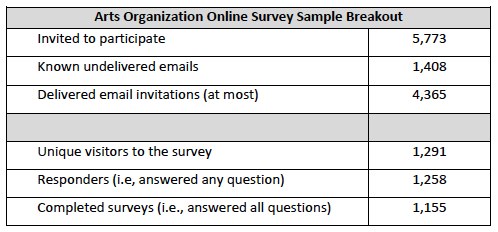
In an effort to obtain the highest possible response rate to the survey, advance letters were mailed to all 5,773 grantees in the sample explaining the purpose of the survey and that they could expect to receive an email invitation to participate in the coming week. The letter included the email address on file for each grantee and asked them to contact Pew Internet if their email address was incorrect.
While the overall goal of the survey was to measure the different ways arts organizations use digital technologies to further their missions, it is important to note that NEA funding is made at the level of individual grantees and project directors, rather than at the organizational level. Several individuals from the same organization may have applied for and been awarded NEA funding during the time period specified, thus the full sample file included information for 5,773 grantees representing 3,644 unique arts organizations. In many cases, the parent organization could be easily identified. However, in the case of larger institutions such as universities and state governments, it could not be determined whether the organizational unit was best defined as the entire institution or as a subunit such as a department or agency. Because of this ambiguity, and in an effort to maximize response rates in a field with considerable staff turnover, advance letters and email invitations were sent to all 5,773 grantees in the sample file. The email invitation alerted grantees to the possibility that more than one individual in their organization may be asked to participate and asked that they coordinate their response with colleagues so that only one survey is submitted on their organization’s behalf.
Email invitations included a live link to the online survey and a unique username and password. When individuals clicked on the survey link, they were sent to a secure login page and asked to enter this information. Thus, arts organizations with no grantee in the file received from NEA could not opt-in to the sample and are not represented in the survey. Of the 5,773 email invitations sent, 1,408 were either rejected by email filters or returned as undeliverable.
Almost all grantees who clicked through to the survey completed at least part of it. Of the 1,291 unique visitors to the survey, 1,258 completed at least part of the survey (1,155 completed the entire survey). All percentages reported are based on those answering each question separately. The response rate for known delivered emails was 29% (1,258/4,365). Given the nature of the sampling frame used for the study, no margin of error has been computed.
The survey was typically completed by the organization’s Executive Director (36%), or a director-level staff member (40%). However, 22% of respondents listed their role as “other,” which included such open-ended answers as General Manager, Grants Officer, Curator, Event Coordinator or Academic Chair, or answers like “I am both Executive Director and Artistic Director.” This reflects the nature of many nonprofit arts organizations where staff members are playing multiple roles, or have more descriptive professional titles. The majority of respondents (81%) said that they were answering questions on behalf of an entire organization. For the remaining 19%, their answers represented a segment or division of a larger institution such as a college/university or federal/state/local government.
Arts Organizations Represented in the Survey
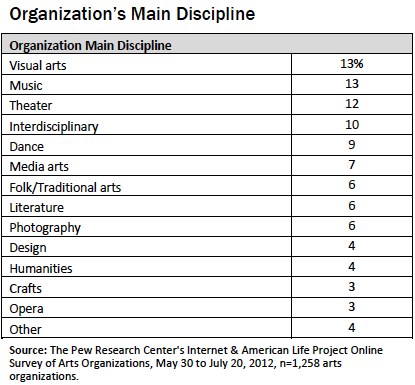
The survey results presented here are not based on a probability sample of arts organizations currently operating in the U.S., yet every effort was made to administer the survey to as broad a sample as is practically possible. The 1,258 NEA grantees who participated in the survey represent mainly the nonprofit arts sector, yet comprise a very diverse sample of organizations. The final sample includes respondents from a wide range of disciplines, including visual arts, music, theater, dance, literature, photography, and media arts.
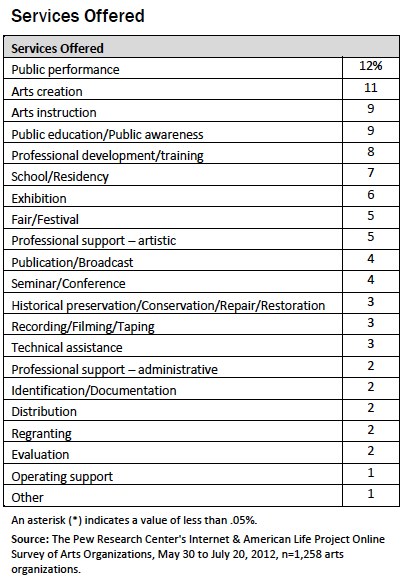
Asked to describe the main function of their organization and the services that it offers, NEA research experts say the answers suggest that the survey represents a broad cross-section of the U.S. arts field. Organizational functions include performance, curation, exhibition, education, and philanthropy.
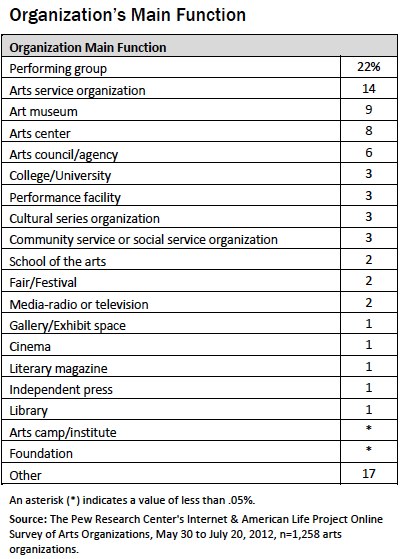
The services provided by these organizations range from curating performances to conducting arts education, media production, supporting the creation of art, and offering technical support and professional development to the arts community. Organizations could check more than one answer regarding the services they offer, and most respondents said their organization provides many of those asked about. Far from focusing on a single task, 49% of respondents report that their organization provides between 4 and 7 services. And, 16% of organizations indicate they provide 10 or more different arts-based services.
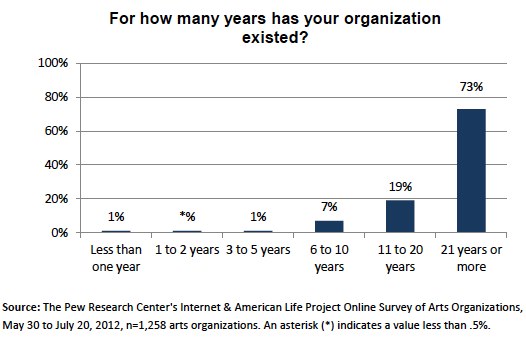
Nearly three-quarters (73%) of individuals participating in the survey represent organizations that have existed for more than 20 years, and another 19% represent organizations that have existed for 11 to 20 years. Only 21 organizations represented in the total sample (2%) have less than five years of history.
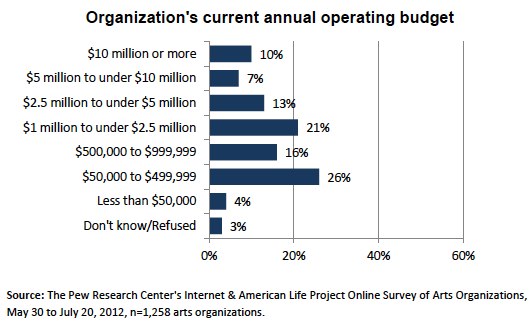
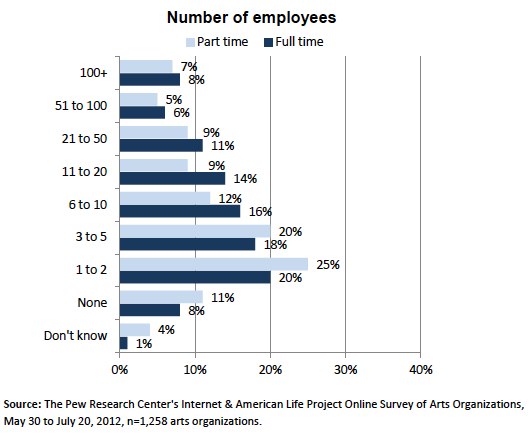
The final sample also includes organizations of all sizes, from very large to very small, with widely varying operating budgets and staff size. Organizational budgets among this group range from less than $50,000 to $10 million or more annually, with the highest proportion in the $50,000 to $499,999 range. Despite these notable differences in organizational budgets, the majority of arts organizations that participated in the survey have a small staff: 68% of organizations have 10 or fewer full time employees, including 45% that have between one and five full-time employees.
The final sample included arts organizations from every state, the District of Columbia and Puerto Rico. States with the largest percentage of respondents included New York (17%), California (14%), Illinois (5%), Pennsylvania (5%), and Texas (5%).
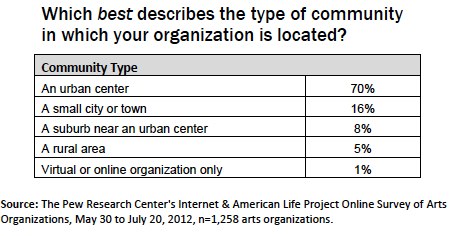
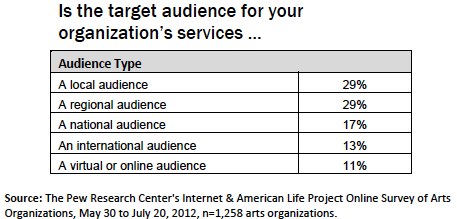
Asked to describe the community in which their organization is currently based, 70% say they are situated in an urban center. However, answers to subsequent survey questions suggest that arts organizations are using technology to stretch beyond these time- and place-based constraints, with some serving not only their immediate locale, but also communities all over the country and world. For example, when asked about the geographic location of their patrons, more than half of the organizations in this sample serve either a local (29%) or regional (29%) audience. Yet another 17% have a national audience, and 13% serve an international community. Some 11% of organizations said they serve a virtual or online community.
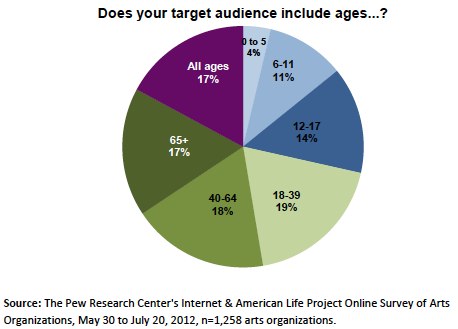
Moreover, the arts organizations that participated in the survey are serving nearly every age group, from very young children to elderly adults. Seventeen percent say they serve patrons of all ages.
Interpreting the results
The arts organizations participating in this survey represent a healthy cross-section of the American arts and culture landscape. They vary considerably in their overall function, the services they provide, the disciplines they promote and support, and the audiences they serve. They also range from the very small to the very large, their location, and the community types in which they are located.
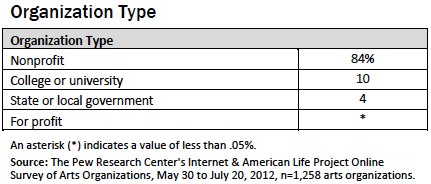
Yet, because they consist entirely of organizations that have received NEA funding in the past five years, they are likely distinct in some ways from the full population of arts organizations currently operating in the U.S. Most notably, this sample is made up of mainly nonprofit organizations (84%), and arts organizations with a fairly long history (73% have existed for 21 years or more). One can conclude due to the length of time they have existed and their ability to procure NEA funding that these are relatively successful organizations when it comes to the grant process. One in 10 participating organizations report an annual operating budget of$10 million or more, which would place them at the highest end of the budgetary scale. And while the majority of organizations participating in this survey have only a handful of full-time employees, 14% have more than 50.
Thus, in interpreting survey results, one should keep in mind that organizations that are less successful in obtaining funding in general, and NEA funding in particular, are likely not part of this sample. The sample also likely skews toward older, more established arts organizations which may be very different from newer organizations or organizations that open and close quickly as part of the natural “churn” in the arts field.
How their relative fundraising success and organizational stability impact survey results is unclear. On one hand, these organizations may be more forward thinking and innovative in their use of technology, because they are successful fundraisers and are more likely to have capital to invest in new projects and initiatives. However, their organizational longevity may work against this type of innovation if they have established organizational practices or audiences that are resistant to change.
Regardless, this sample of arts organizations promotes engagement across the arts, serves all types of artists and audiences, and represents all regions of the country and audiences of all ages. And though most report being located in urban centers, three in ten (29%) operate in smaller communities. Thus, their insights provide a comprehensive look at how today’s arts organizations are using the internet, social media, and other digital technologies to further their missions.


