Adults
This report is based on the findings of a survey on Americans’ use of the Internet. The results in this report are based on data from telephone interviews conducted by Princeton Survey Research Associates International from January 20 to February 19, 2012, among a sample of 2,253 adults, age 18 and older. Telephone interviews were conducted in English and Spanish by landline (1,352) and cell phone (901, including 440 without a landline phone). For results based on the total sample, one can say with 95% confidence that the error attributable to sampling is plus or minus 2.3 percentage points. For results based Internet users (n=1,729), the margin of sampling error is plus or minus 2.7 percentage points. In addition to sampling error, question wording and practical difficulties in conducting telephone surveys may introduce some error or bias into the findings of opinion polls.
A combination of landline and cellular random digit dial (RDD) samples was used to represent all adults in the continental United States who have access to either a landline or cellular telephone. Both samples were provided by Survey Sampling International, LLC (SSI) according to PSRAI specifications. Numbers for the landline sample were selected with probabilities in proportion to their share of listed telephone households from active blocks (area code + exchange + two-digit block number) that contained three or more residential directory listings. The cellular sample was not list-assisted, but was drawn through a systematic sampling from dedicated wireless 100-blocks and shared service 100-blocks with no directory-listed landline numbers.
New sample was released daily and was kept in the field for at least five days. The sample was released in replicates, which are representative subsamples of the larger population. This ensures that complete call procedures were followed for the entire sample. At least 7 attempts were made to complete an interview at a sampled telephone number. The calls were staggered over times of day and days of the week to maximize the chances of making contact with a potential respondent. Each number received at least one daytime call in an attempt to find someone available. For the landline sample, interviewers asked to speak with the youngest adult male or female currently at home based on a random rotation. If no male/female was available, interviewers asked to speak with the youngest adult of the other gender. For the cellular sample, interviews were conducted with the person who answered the phone. Interviewers verified that the person was an adult and in a safe place before administering the survey. Cellular sample respondents were offered a post-paid cash incentive for their participation. All interviews completed on any given day were considered to be the final sample for that day.
Weighting is generally used in survey analysis to compensate for sample designs and patterns of non-response that might bias results. A two-stage weighting procedure was used to weight this dual-frame sample. The first-stage corrected for different probabilities of selection associated with the number of adults in each household and each respondent’s telephone usage patterns.12 This weighting also adjusts for the overlapping landline and cell sample frames and the relative sizes of each frame and each sample.
The second stage of weighting balances sample demographics to population parameters. The sample is balanced to match national population parameters for sex, age, education, race, Hispanic origin, region (U.S. Census definitions), population density, and telephone usage. The Hispanic origin was split out based on nativity; U.S born and non-U.S. born. The White, non-Hispanic subgroup is also balanced on age, education and region. The basic weighting parameters came from a special analysis of the Census Bureau’s 2011 Annual Social and Economic Supplement (ASEC) that included all households in the United States. The population density parameter was derived from Census 2000 data. The cell phone usage parameter came from an analysis of the July-December 2010 National Health Interview Survey.13
Below is the full disposition of all sampled telephone numbers:
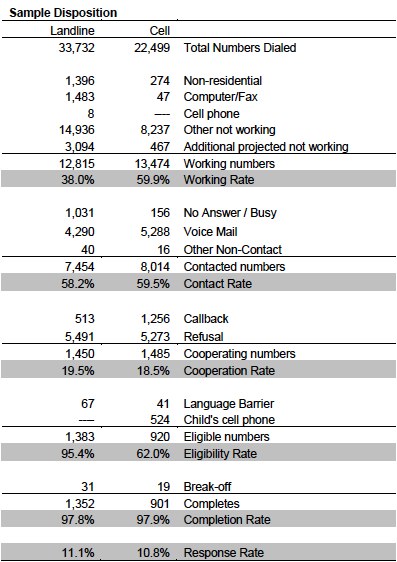
The disposition reports all of the sampled telephone numbers ever dialed from the original telephone number samples. The response rate estimates the fraction of all eligible respondents in the sample that were ultimately interviewed. At PSRAI it is calculated by taking the product of three component rates:
- Contact rate – the proportion of working numbers where a request for interview was made
- Cooperation rate – the proportion of contacted numbers where a consent for interview was at least initially obtained, versus those refused
- Completion rate – the proportion of initially cooperating and eligible interviews that were completed
Thus the response rate for the landline sample was 11 percent. The response rate for the cellular sample was 11 percent.
View and/or download the survey questions on the report overview page.
Teens
2011 Teens and Digital Citizenship Survey
Prepared by Princeton Survey Research Associates International for the Pew Research Center’s Internet and American Life Project
JULY 2011
Summary
The 2011 Teens and Digital Citizenship Survey sponsored by the Pew Research Center’s Internet and American Life Project obtained telephone interviews with a nationally representative sample of 799 teens ages 12 to 17 years old and their parents living in the continental United States. The survey was conducted by Princeton Survey Research Associates International. The interviews were conducted in English and Spanish by Princeton Data Source, LLC from April 19 to July 14, 2011. Statistical results are weighted to correct known demographic discrepancies. The margin of sampling error for the complete set of weighted data is ±4.8 percentage points.
In addition to the two surveys, this study conducted 7 focus groups with teens between the ages of 12 and 19 in the greater Washington, DC metro area in January and February 2011. Participants were recruited via word of mouth, email, schools, and non-profit organizations. A total of 57 youth participated in the focus groups, though each group averaged 8 to 14 people. Groups were co-ed, but were broken into middle school and high school aged youth. The groups were balanced for gender and crossed the socio-economic and family structure spectrum. Black youth were over-represented. All participants were required to have access to either a computer or a cell phone to participate. Participants were paid a $40 cash incentive for their participation. Parental consent was obtained for all minor participants, as was the assent of the minor participants themselves. Eighteen and 19 year-old participants consented to their own participation.
Further details on the design, execution, and analysis of the teen and parent telephone survey are discussed below.
Design and Data Collection Procedures
Sample Design
A combination of landline and cellular random digit dial (RDD) samples was used to represent all teens and their parents in the continental United States who have access to either a landline or cellular telephone. Both samples were provided by Survey Sampling International, LLC (SSI) according to PSRAI specifications.
Both samples were disproportionately stratified to increase the incidence of blacks and Latinos. The same stratification scheme was used for both sample frames and was based on the estimated incidence of minority groups at the county level. All counties in the continental United States were divided into ten strata based on the estimated proportion of African American and Latino populations. Strata with higher minority densities were oversampled relative to strata with lower densities. Phone numbers were drawn with equal probabilities within strata. The disproportionate sample design was accounted for in the weighting and does not affect the representative nature of the sample.14
Contact Procedures
Interviews were conducted from April 19 to July 14, 2011. As many as 7 attempts were made to contact and interview a parent at every sampled telephone number. After the parent interview, if the teen was not immediately available, an additional 7 calls were made to interview an eligible teen. Sample was released for interviewing in replicates, which are representative subsamples of the larger sample. Using replicates to control the release of sample ensures that complete call procedures are followed for the entire sample. Calls were staggered over times of day and days of the week to maximize the chance of making contact with potential respondents. Each telephone number received at least one daytime call in an attempt to complete an interview.
Contact procedures were slightly different for the landline and cell samples. For the landline sample, interviewers first determined if the household had any 12 to 17 year-old residents. Households with no teens were screened-out as ineligible. In eligible households, interviewers first conducted a short parent interview with either the father/male guardian or mother/female guardian. The short parent interview asked some basic household demographic questions as well as questions about a particular teen in the household (selected at random if more than one teen lived in the house.)
For the cell phone sample, interviews first made sure that respondents were in a safe place (for example, not driving) to talk and that they were speaking with an adult. Calls made to minors were screened-out as ineligible. If the person was not in a safe place to talk a callback was scheduled. Interviewers then asked if any 12- to 17-year-olds lived in their household. Cases where no teens lived in the household were screened-out as ineligible. If there was an age-eligible teen in the household, the interviewers asked if the person on the cell phone was a parent of the child. Those who were parents went on to complete the parent interview. Those who were not parents were screened-out as ineligible.
For both samples, after the parent interview was complete an interview was completed with the target child. Data was kept only if the child interview was completed.15
Interviewers were given instructions to tell parents – if asked – that they should not remain on the phone with the child during the interview, but that if they were concerned they could sit nearby. The interviewer then coded whether or not the parent remained on the phone with the child. In this survey, 90 of the 799 interviews (or 11%) had a parent listening on the phone during the child’s interview. Parents who elected to remain on the phone while their child completed the interview were more likely to be listening to the interviews of girls and children age 12 and to a lesser extent, age 13. These parents were also more likely to be white. Teens whose parents listened to their interview were less likely to use the internet, use social network sites, or go online using a mobile phone. Among those teens whose parents attended their interview who do use social network sites, they were more likely to report using Facebook than teens whose parents did not listen in. We elected to retain these interviews as a part of our larger sample – first because there were very few statistically significant differences between the responses of teens whose parents listened in, and those whose parents did not. Second, in the places where we did see modest differences, understanding what might be behind those differences was difficult to tease out – the age of the child may have been a factor, or how the parent parented that child, or the fact that the parent was listening to the interview. So rather than introduce additional bias into the data, we elected to leave the cases in the data set, and note in the text where the parent’s listening made a statistically significant difference in the responses of the teen.
Weighting and analysis
Weighting is generally used in survey analysis to compensate for patterns of nonresponse and disproportionate sample designs that might bias survey estimates. This sample was weighted in three stages. The first stage of weighting corrected for the disproportionate RDD sample designs. For each stratum the variable SAMPWT was computed as the ratio of the size of the sample frame in the stratum divided by the amount of sample ordered in the stratum.
The second stage of weighting involved correcting for different probabilities of selection based on respondents’ phone use patterns. Respondents who have both a landline and a cell phone have a greater chance of being sampled than respondents with access to only one kind of phone. To correct for this we computed a variable called PUA (Phone Use Adjustment). Respondents with one kind of phone (either landline or cell) were assigned a PUA of 0.5 while respondents with both types of phones were assigned a PUA of 1.0. SAMPWT and PUA were then multiplied together to use as an input weight (WEIGHT1) for post-stratification raking
The interviewed sample was raked to match national parameters for both parent and child demographics. The parent demographics used for weighting were: sex; age; education; race; Hispanic origin; number of 12- to 17-year-olds in household; phone use and region (U.S. Census definitions). The child demographics used for weighting were gender and age. The parameters came from a special analysis of the Census Bureau’s 2010 Annual Social and Economic Supplement (ASEC) that included all households in the continental United States. The phone use parameter was derived from recent PSRAI survey data.
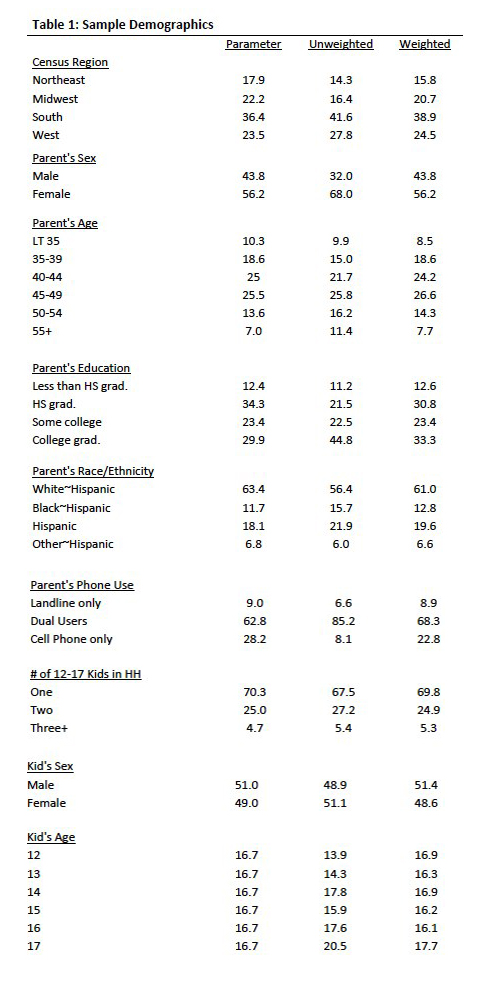
Raking was accomplished using Sample Balancing, a special iterative sample weighting program that simultaneously balances the distributions of all variables using a statistical technique called the Deming Algorithm. Weights were trimmed to prevent individual interviews from having too much influence on the final results. The use of these weights in statistical analysis ensures that the demographic characteristics of the sample closely approximate the demographic characteristics of the national population. Table 1 compares weighted and unweighted sample distributions to population parameters.
Effects of Sample Design on Statistical Inference
Post-data collection statistical adjustments require analysis procedures that reflect departures from simple random sampling. PSRAI calculates the effects of these design features so that an appropriate adjustment can be incorporated into tests of statistical significance when using these data. The so-called “design effect” or deff represents the loss in statistical efficiency that results from systematic non-response. The total sample design effect for this survey is 1.95.
PSRAI calculates the composite design effect for a sample of size n, with each case having a weight, wi as:

In a wide range of situations, the adjusted standard error of a statistic should be calculated by multiplying the usual formula by the square root of the design effect (√deff ). Thus, the formula for computing the 95% confidence interval around a percentage is:

Response Rate
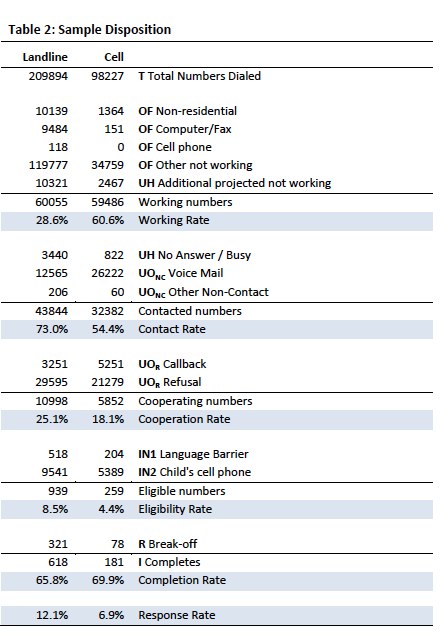
Table 2 reports the disposition of all sampled callback telephone numbers ever dialed. The response rate estimates the fraction of all eligible respondents in the sample that were ultimately interviewed. At PSRAI it is calculated by taking the product of three component rates:16
- Contact rate – the proportion of working numbers where a request for interview was made17
- Cooperation rate – the proportion of contacted numbers where a consent for interview was at least initially obtained, versus those refused
- Completion rate – the proportion of initially cooperating and eligible interviews that agreed to the child interview and were completed
Thus the response rate for landline sample was 12 percent and the response rate for the cell sample was 7 percent.
Survey questions are available to download as a PDF on the report overview page.


