
Note: For the Center’s 2024 report on Latinx and other pan-ethnic terms, read “Latinx Awareness Has Doubled Among U.S. Hispanics Since 2019, but Only 4% Use It.”
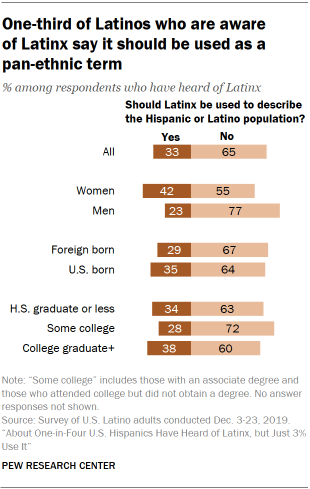
Latinx has emerged in recent years as a new pan-ethnic term to describe the nation’s diverse Hispanic population. However, the new survey shows most (65%) who have heard the term say it should not be used to describe the Hispanic or Latino population, while one-third say it should be used.
Among those who have heard the term Latinx, Hispanic women are more likely than men to say the term should be used to describe the Hispanic or Latino population. Some 42% of women say this compared with 23% of Hispanic men.
Hispanic is the preferred term to describe the Hispanic or Latino population overall
When asked about their preferred pan-ethnic term to describe the Hispanic or Latino population, a vast majority of adults say they prefer other terms over Latinx. Only 4%, according to the new survey, prefer Latinx to describe the Hispanic or Latino population. Meanwhile, 61% say they prefer the term Hispanic, followed by 29% who prefer the term Latino and 5% who say something else.
Though few say they prefer Latinx, those who have heard the term are more likely to prefer it as a pan-ethnic term than those who have not heard it. One-in-ten (10%) who have heard the term Latinx prefer it to describe the Hispanic or Latino population, significantly higher than the share among those who have not heard the term (2%) and the share among all Latino adults (4%).
There are some differences by age and nativity in pan-ethnic term preferences. Among those ages 18 to 29, 8% say they prefer Latinx over other terms, slightly higher than the share among older adults. In addition, 6% of those who are U.S. born say they prefer Latinx, compared with 2% among immigrants.
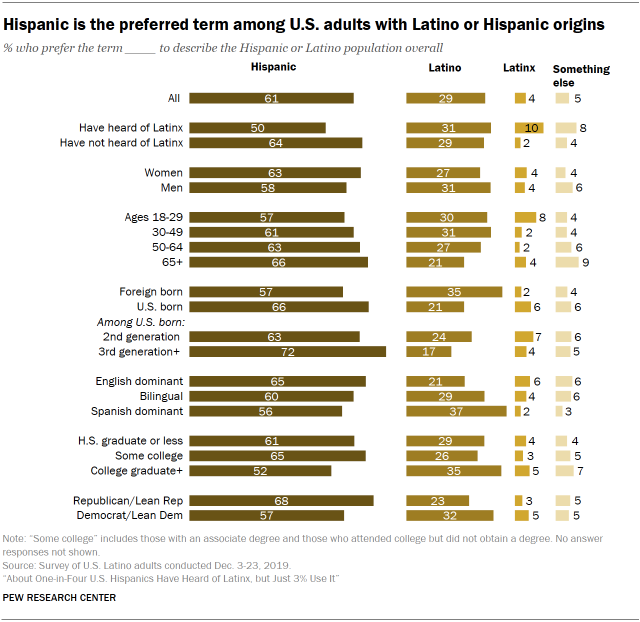
Across demographic subgroups, the term Hispanic is preferred by about half or more of respondents. Those who are third generation or higher (72%) are among the most likely to prefer Hispanic. Even among those who have heard the term Latinx, 50% say they prefer Hispanic to describe the nation’s Hispanic or Latino population.
Meanwhile, immigrants, college graduates and predominantly those who speak mainly Spanish are among the most likely to prefer the term Latino.


