

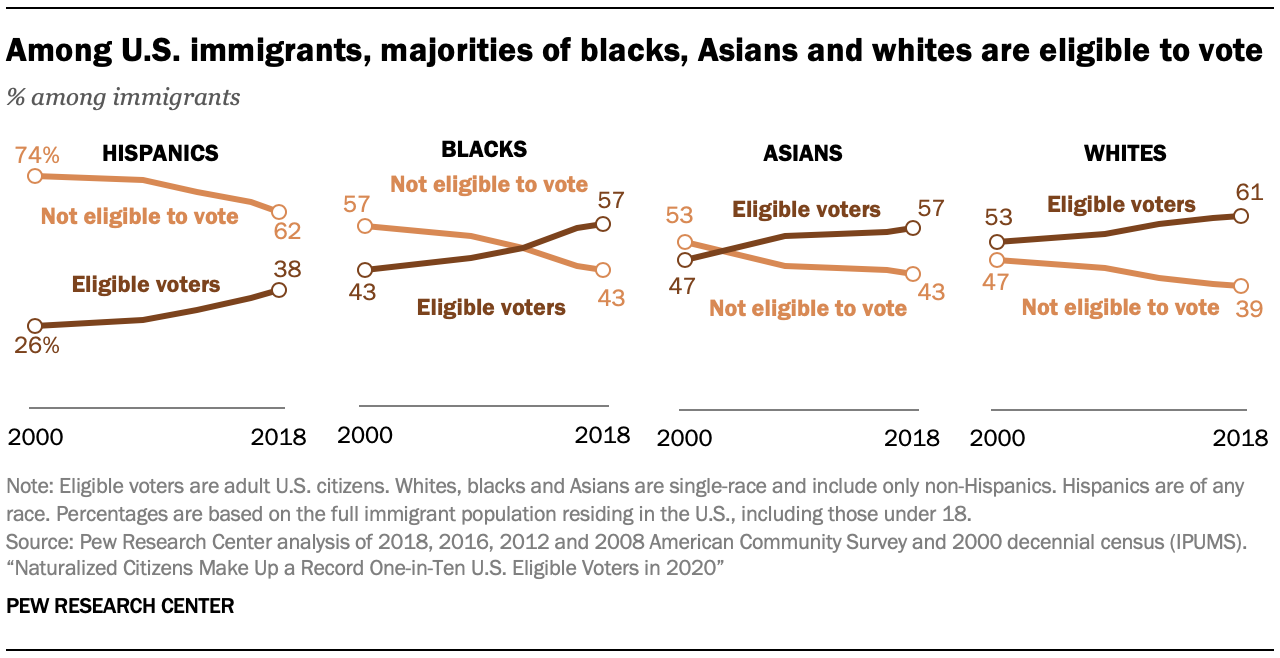
Not all immigrants are U.S. citizens, and as a result, not all immigrants are eligible to vote in federal elections.4
The share of immigrants who are eligible to vote varies considerably by race and ethnicity. Notably, fewer than half (38%) of Hispanic immigrants are eligible voters, but this share has increased since 2000, when only about one-quarter of Hispanic immigrants were eligible.5
More than half of black and Asian immigrants (57% each) are eligible to vote. For Asians, majorities have been able to vote since 2008, while for blacks this has been true since 2016. About six-in-ten white immigrants are eligible voters. They are the only group in which more than half have been eligible since 2000.
A demographic profile of the foreign-born electorate
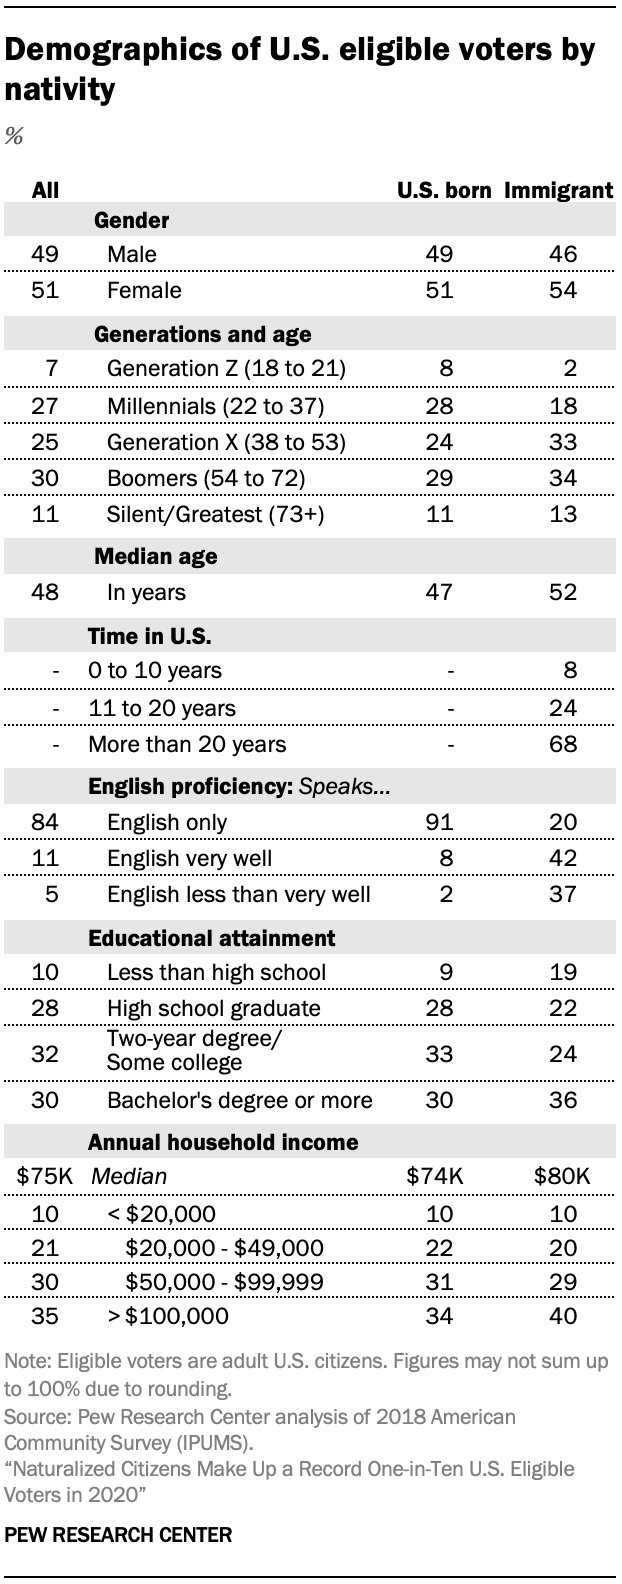
The demographics of immigrant eligible voters differ from those of U.S.-born eligible voters in many ways: Immigrant voters are older, less proficient in English and live in households with higher incomes.
Age
Immigrant eligible voters are older than those who are U.S. born. The median age of immigrant voters is 52, compared with 47 for the U.S. born.
By generation, nearly half (47%) of all immigrant eligible voters are Baby Boomers or members of the Silent or Greatest generations. By comparison, 40% of U.S.-born eligible voters are members of those same generations. Additionally, Millennials make up only 18% of all immigrants who can vote, while among U.S.-born voters, the Millennial share is higher, at 28%.
English proficiency
Among immigrant eligible voters, nearly four-in-ten say they speak English less than very well, which is a far higher share than that among U.S.-born eligible voters (just 2%).6
Household income
Immigrant eligible voters live in households with a median income of $80,100, a higher amount than the U.S.-born eligible voter’s household median of $74,000. Among immigrant eligible voters, 40% have annual household incomes of $100,000 or more, compared with 34% among U.S.-born families.
Educational attainment
Another notable difference between immigrant and U.S.-born eligible voters is level of educational attainment. Among immigrant voters, 36% have at least a bachelor’s degree, while among U.S.-born voters, the share is 30%.
Demographic differences between immigrant and U.S.-born eligible voters vary by race and ethnicity
Among all major racial or ethnic groups, immigrant eligible voters are older than U.S.-born voters. However, the differences in median age between immigrant and U.S.-born voters vary by racial and ethnic group.
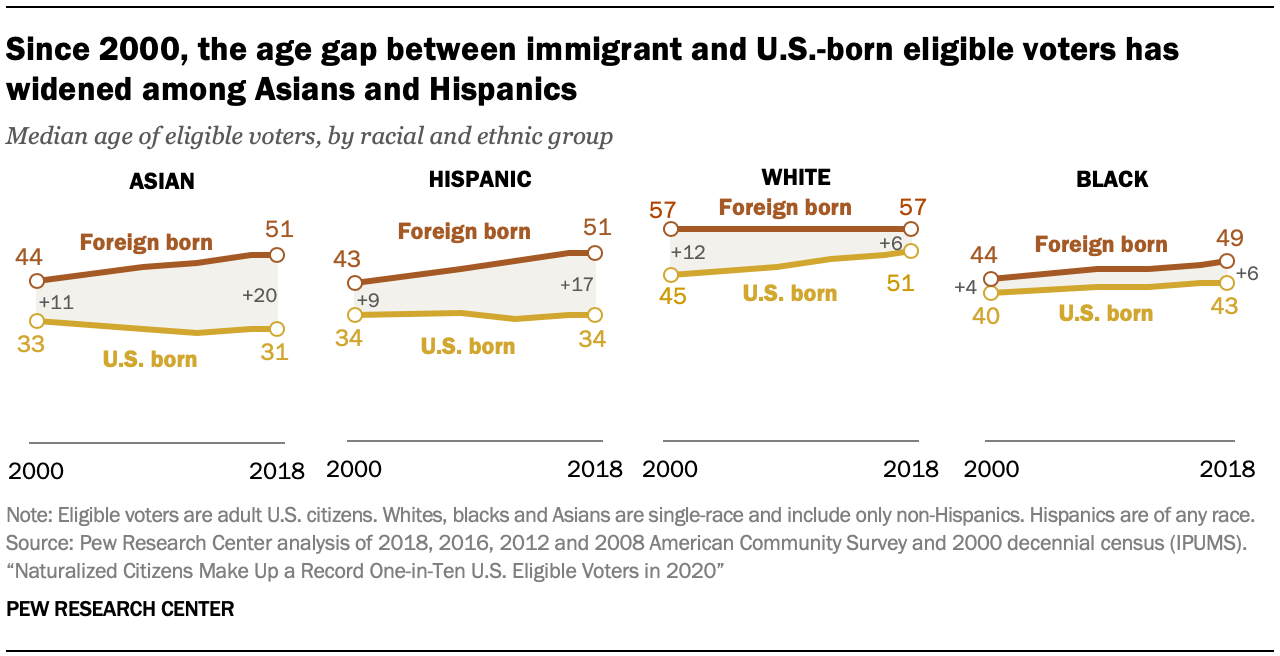
Among Asian and Hispanic eligible voters, immigrants are significantly older than the U.S. born. The median age of Asian immigrant eligible voters is 51, compared with 31 for Asian voters born in the U.S. Among Hispanics, immigrant eligible voters have a median age of 51, compared with 34 for the U.S. born. However, the gap between white and black eligible voters is not as wide. The median age of white immigrant voters is 57 while its 51 for the U.S.-born. As for black eligible voters, the median age of immigrants is 49, compared with 43 among those born in the U.S.
Since 2000, the median age gap between immigrant voters and U.S.-born voters has widened between Asian and Latino eligible voters but narrowed among white eligible voters and is little changed among black eligible voters. In the case of Asian eligible voters, the gap in median age between immigrants and the U.S. born is the widest of any group. It has grown from 11 years in 2000 to 20 years in 2018. For Latino eligible voters, the gap in median age between immigrants and the U.S. born has grown from nine to 17 years over the same period.
Meanwhile, the age gap between immigrant and U.S.-born white eligible voters has narrowed, falling from 12 years in 2000 to six in 2018. By contrast, the median age gap has changed little over the same period for black eligible voters.
The widening age gap between Asian and Hispanic eligible voters is the result of the changing demographics and naturalization rates for both groups. Even though Asians make up the largest group of new immigrant arrivals, not all immigrants from Asia become U.S. citizens. And those who have become citizens tend to be older and have lived in the U.S. for longer. Meanwhile, for Hispanics, immigration from Latin America has slowed sharply in the last decade. As a result, Hispanic immigrants with U.S. citizenship are aging. At the same time, U.S. births to Hispanic parents have been the principal driver of Hispanic population growth for nearly two decades. Young Hispanics born in the U.S. are now entering adulthood in large numbers, bringing down the median age of U.S.-born Hispanic eligible voters.
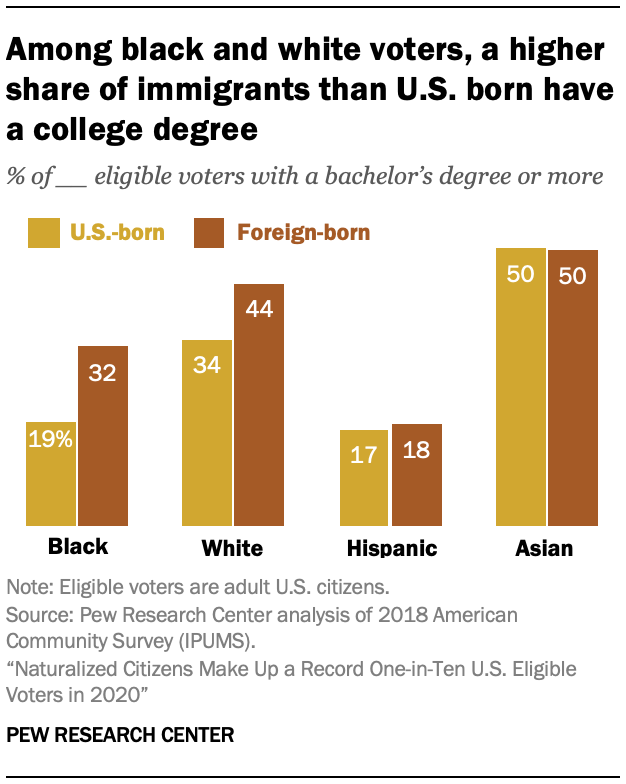
When it comes to educational attainment, black and white eligible voters have the widest gaps between immigrants and the U.S. born. Among black voters, 32% of immigrants have a bachelor’s degree or more, compared with 19% of the U.S. born. This 13 percentage point gap is the largest of the racial or ethnic groups included in this analysis.
Among white eligible voters, 44% of immigrants have a bachelor’s degree or more, while 34% of the U.S. born do, a gap of 10 points. By contrast, there is little to no gap in educational attainment among Asian or Hispanic eligible voters.


