Unauthorized Immigrants—Overview
The data presented in this report on unauthorized and legal immigrants were developed through a multistage estimation process, principally using March Supplements to the Current Population Survey (CPS). The CPS is a monthly survey of about 55,000 households conducted jointly by the Bureau of Labor Statistics and the Census Bureau; the sample is expanded to about 80,000 households for the March supplement.
The first stage in the estimation process uses CPS data as a basis for estimating the number of legal and unauthorized immigrants included in the survey and the total number in the country using a residual estimation methodology, described in detail in previous reports and papers (especially Passel and Cohn 2008; Passel 2007).
Then, the March CPS Supplements are augmented to assign a specific legal status (one option is unauthorized immigrant) to each foreign-born survey respondent and to adjust the survey weights to account for immigrants missing from the survey. These augmented files serve as a basis for the detailed tabulations of the family, social, economic and geographic characteristics presented here. The data and methods for the overall process were developed initially at the Urban Institute by Passel and Clark (especially 1998) and were extended by work of Passel, Bean and Van Hook (2004) and by subsequent work at the Pew Hispanic Center.
The residual method compares the number of immigrants in the CPS with an independently derived demographic estimate of legal foreign-born residents. The difference between the survey total and the estimated legal foreign-born population is an estimate of unauthorized immigrants included in the survey. Variants of the residual method have been widely used and are generally accepted as the best current estimates. The initial estimates here are calculated separately for age-gender groups in six states (California, Texas, Florida, New York, Illinois and New Jersey) and the balance of the country and for 35 countries or groups of countries by period of arrival in the United States.
The next step adjusts the estimates of legal and unauthorized immigrants counted in the survey for omissions. The basic information on coverage is drawn principally from comparisons with Mexican data, U.S. mortality data and specialized surveys conducted at the time of the 2000 Census (Bean et al. 1998; Capps et al. 2002; Marcelli and Ong 2002). These adjustments increase the estimate of the legal foreign-born population, generally by 1-3%, and of the unauthorized immigrant population by 10-15%. For 2008, these procedures yielded an estimate of 11.9 million unauthorized immigrants in the United States with 7 million from Mexico (Passel and Cohn 2008).
Status Assignments—Legal and Unauthorized Immigrants
Individual respondents are assigned a status as a legal or unauthorized immigrant based on the individual’s demographic, social, economic and geographic characteristics so the resulting number of immigrants in various categories agrees with the totals from the residual estimates. The assignment procedure employs a variety of methods, assumptions and data sources.
First, all immigrants entering the U.S. before 1980 are assumed to be legal immigrants. Then, the CPS data are corrected for known over-reporting of naturalized citizenship on the part of recently arrived immigrants (Passel et al. 1997) and all remaining naturalized citizens from countries other than Mexico and those in Central America are assigned as legal. Persons entering the U.S. as refugees are identified on the basis of country of birth and year of immigration to align with known admissions of refugees and asylees (persons granted asylum). Then, individuals holding certain kinds of temporary visas (including students, diplomats and “high-tech guest workers”) are identified in the survey and each is assigned a specific legal temporary migration status using information on country of birth, date of entry, occupation, education and certain family characteristics. Finally, some individuals are assigned as legal immigrants because they are in certain occupations (e.g., police officer, lawyer, military occupation, federal job) that require legal status or because they are receiving public benefits (e.g., welfare or food stamps) that are limited to legal immigrants. As result of these steps, the foreign-born population is divided between individuals with “definitely legal” status (including long-term residents, naturalized citizens, refugees and asylees, legal temporary migrants, and some legal permanent residents) and a group of “potentially unauthorized” migrants.
The number of potentially unauthorized migrants exceeds the estimated number of unauthorized migrants (from the residual estimates) by 20-35%. So, to have a result consistent with the residual estimate of legal and unauthorized immigrants, probabilistic methods are employed to assign legal or unauthorized status to these potentially unauthorized individuals. This last step also involves a check to ensure that the legal statuses of family members are consistent; for example, all family members entering the country at the same time are assumed to have the same legal status. The entire process requires several iterations to produce estimates that agree with the demographically derived population totals. At the end, the final estimates agree with the residual estimates for the six individual states noted earlier and for the balance of the country; for Mexican-born and other legal and unauthorized immigrants in each area; and for children, working-age men and working-age women within each category. Finally, the survey weights for the foreign-born are adjusted upward so the tabulated figures agree with the analytic, demographic estimates of the total number of legal and unauthorized migrants developed in the very first step.
This methodology obviously requires a number of assumptions and is applied to survey data from a sample (albeit a large one). The resulting estimates, such as those presented here, are subject to both sampling and non-sampling error. Accordingly, small differences should not be treated as significant or substantive. Sampling error intervals have been developed for the national estimates of all unauthorized immigrants and totals by country or region of birth. These estimates were presented in Passel and Cohn (2008).
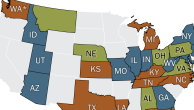
State-level Estimates
Principally because of concerns relating to the relatively small sample sizes for the foreign-born in some states, all of the state-level estimates presented in this report (total population, labor force, Mexican unauthorized immigrants and K-12 school enrollment) are based on averages from the 2006-08 surveys adjusted to agree with 2008 totals. Error ranges for the size of the unauthorized immigrant population in each state are based on both sampling variability and trend lines of the state-specific estimates for 2000-08.
All state-level estimates for unauthorized immigrant populations are presented as rounded numbers to avoid the appearance of unwarranted precision in the estimates. No estimates smaller than 10,000 are shown. Estimates in the range of 10,000-100,000 are rounded to the nearest 5,000; estimates in the range of 100,000-250,000 to the nearest 10,000; estimates smaller than 1 million to the nearest 25,000; and estimates larger than that to the nearest 50,000. The same rounding conventions are applied to estimates for 2005 (based on averages of 2004-06) and for 2000.
CPS Weights
Because of significant revisions in the Census Bureau’s methods for estimating population introduced with the 2008 CPS, it was necessary to correct the population weights used in the CPS. Without this reweighting, some potentially large differences over time in both numbers and characteristics of unauthorized immigrants could be due entirely to the altered population estimates and not to any real changes in the population. To control for this source of variation, new CPS weights consistent with the revised population figures were produced for 2003-07. (Revisions for 2001 and 2002 are still in production.) See Passel and Cohn (2008) for more discussion of this weighting issue.
Country of Birth
Some modifications in the original CPS countries of birth were introduced to ensure that all foreign-born respondents could be assigned to a specific country or region of birth. See Passel and Cohn (2008) for a detailed treatment of how persons with unknown country of birth were assigned to specific countries.
The estimates of the unauthorized population shown in this report divide the world into regions. “Latin America” is defined to include Mexico, Central America, Caribbean countries and South America. “Europe” includes Russia and all of the newly independent countries that were part of the former Soviet Union, even though some of the countries are geographically in Asia. This grouping is designed to maintain maximum consistency over time and with the administrative data series used. While all of these countries are separately identified in immigration statistics since their independence, they do not appear in immigration statistics of the 1980s and most are not identified as countries of birth in the CPS.
Because more detailed information is available on country of birth than in our earlier report (Passel and Cohn 2008), the remaining groupings are slightly different from those previously published. “Middle East” as defined here includes countries of southwest Asia from Turkey and Cyprus in the north and west to Iran in the east to the Arabian Peninsula in the south; it also includes countries of North Africa (Egypt, Sudan, Libya, Tunisia, Algeria, Morocco and Western Sahara). Note that the Middle East does not include Afghanistan or Pakistan. “South and East Asia” is the rest of Asia from Afghanistan and Pakistan eastward. “Other” consists of sub-Saharan Africa and Oceania; in addition, the few respondents not assigned to any other area are categorized as being from “Other.”
K-12 School Enrollment
The March CPS collects information on school enrollment only for U.S. residents ages 16-24. The figures cited in the text for enrollment in grades kindergarten through 12 were obtained by combining the enrollment data from the CPS for ages 16-19 with new estimates for younger ages. K-12 enrollment rates, in public and private schools, were obtained from the American Community Survey (ACS), which is conducted by the U.S. Census Bureau and does collect such information. Rates specific to each state, for immigrants and the U.S. born, and for ages 3-5 and 6-15 from the ACS were applied to CPS population data by age, states, and nativity of parents and children to obtain the final estimates of K-12 enrollment.
Metropolitan-Nonmetropolitan Residence
All individuals in the country live in either a metropolitan area or a nonmetropolitan area. However, to protect the privacy of respondents who live in metropolitan or nonmetropolitan areas with small populations, the Census Bureau does not report whether the respondent lives in a metropolitan area or a nonmetropolitan area for about 14% of the population included in the CPS. Thus, in the CPS, the entire population is divided into three area groups—metropolitan, nonmetropolitan and “not identified”—rather than just metropolitan and nonmetropolitan.
A comparison of the CPS data for people who can be identified as metropolitan or nonmetropolitan residents with the official Census Bureau population estimates for all metropolitan and nonmetropolitan areas finds that the shares of the two areas are similar. This suggests that the remaining CPS cases (those people who cannot be assigned metropolitan or nonmetropolitan residence) follow the same pattern. Thus, the vast majority of people living in “not identified” areas actually live in smaller metropolitan areas—areas that are below the population threshold that would permit them to be identified in the CPS. Accordingly, the metropolitan proportions reported in this analysis were estimated based on the 86% of CPS cases that could be assigned as either metropolitan or nonmetropolitan.