
In this report, we explored factors related to people’s perceptions of the way democracy is working in their country. To do this, we performed a multilevel regression analysis predicting democratic dissatisfaction as a function of people’s key attitudes on economic, political, social and security issues in their country, as well as their demographic characteristics. Specifically, we used Stata’s melogit function to estimate a weighted, mixed-effect logistic model with random intercepts by country and robust standard errors. In addition to this pooled model, we evaluated the robustness of the results by estimating the model for each country separately. These country-specific models yielded similar conclusions.
Dissatisfaction with democracy is the dichotomous dependent variable, where 1 denotes someone is dissatisfied with democracy in their country (those who are not too or not at all satisfied) and 0 means someone is satisfied with the way democracy is working in their country (those who say they are very or somewhat satisfied). The independent, or predictor, variables include evaluations of the current economic situation, attitudes about immigration, support for the governing party or parties, age, gender, education and an indicator for the country’s level of economic development (whether it is an advanced or emerging economy – for more, see Appendix C). Additional variables related to respondents’ views of their country were also included as predictors.
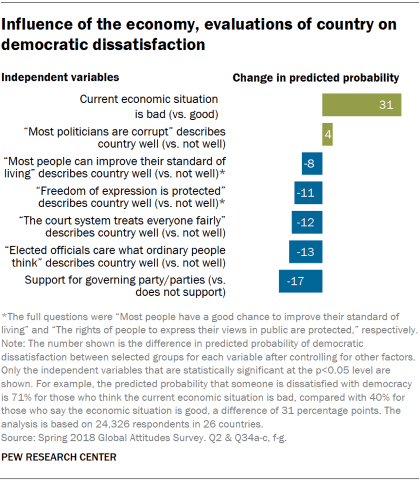
Overall, we find that negative views of the current economic situation have a strong association with individual democratic dissatisfaction. Holding everything else constant, a person who says the current economic situation in their country is bad has a 71% chance of also being dissatisfied with the way democracy is working in their country. In contrast, someone with a positive outlook on their country’s economic situation has a 40% chance – a difference of 31 percentage points. In addition to attitudes about the economic situation, individuals who describe their country as one in which most politicians are corrupt are on average 4 points more likely to express democratic dissatisfaction than those who do not think this describes their country well (58% and 54%, respectively). The relationship between views of corruption and democratic dissatisfaction is relatively small, however.
Respondents’ other opinions about their country also relate to democratic dissatisfaction. People were asked to evaluate their country on a number of dimensions, and in each case, people who said their country was well-described by the following statements were more satisfied: “Most people can improve their standard of living,” “courts treat everyone fairly,” “freedom of expression is protected,” and “officials care what ordinary people think.”
Partisan affiliation is also related to democratic dissatisfaction, controlling for other factors. For example, the chance that someone who supports the governing party (or parties) is dissatisfied is 45%, compared with someone who does not support the party in power who has a predicted probability of dissatisfaction of 62%, a difference of 17 percentage points.
After accounting for the above variables, other factors were not predictive of democratic dissatisfaction. Describing their country as one in which most people live in areas where it is dangerous to walk around at night and saying that things do not change very much no matter who wins an election were not significantly related to dissatisfaction with how democracy is performing. Neither were attitudes toward immigration (allow more, the same, or less/none immigrants into the country), the level of economic development (advanced vs. emerging economy) or the respondent’s demographics (age, gender and education).
Factors that influence democratic dissatisfaction in Europe
Alongside the global model, we also evaluated a weighted, mixed-effect logistic regression model for the 10 European countries surveyed. In addition to the factors highlighted above, this analysis allows us to evaluate favorability of the EU, opinions regarding whether immigrants want to adopt their country’s customs and way of life, and favorable views of right- and left-wing populist parties. As with the previous model, we also estimated models for each country separately to verify its robustness; these results yielded similar findings to the pooled regression model.
Overall, the European predictors of democratic dissatisfaction are very similar to the pooled model. Again, negative views of the current economic situation and the view that most politicians are corrupt are linked to greater levels of democratic dissatisfaction. Those who have favorable views of right-wing populist parties are also more dissatisfied. For example, a person with a positive view of a right-wing populist party in their country (see Appendix B for how we classified populist parties using the Chapel Hill Expert Survey) has a predicted probability of being dissatisfied with the way democracy is working in their country of 64%. A person who does not sympathize with a right-wing populist party has a 55% chance of being dissatisfied, a 9 percentage point difference.
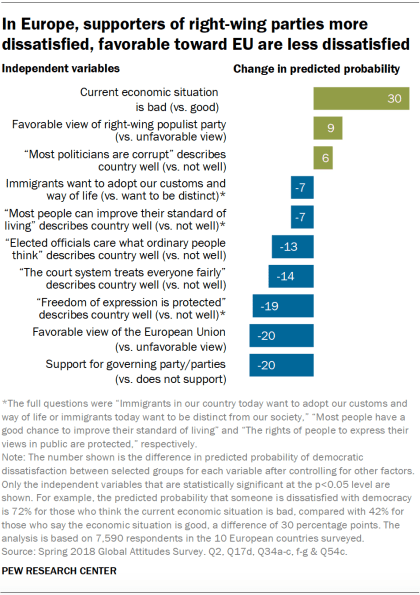
A host of other factors are associated with democratic dissatisfaction in Europe as well. Those who say most immigrants want to adopt their country’s culture and way of life are less likely to be dissatisfied with democracy than those who think immigrants today want to remain distinct (53% and 60%, respectively), although the impact of this factor is small. Those who evaluate their country as one in which most can improve their standard of living, elected officials care what ordinary people think, courts treat everyone fairly, and freedom of expression is protected are more satisfied with the way democracy is working in their country.
Favorable views of the EU and support for the governing party or parties in power are also strongly correlated with democratic dissatisfaction. For example, those who have favorable views of the EU have a 49% chance of being dissatisfied with democracy. Those who are unfavorable toward the Brussels-based institution have a 69% chance of being dissatisfied, a 20 percentage point difference.
This complementary analysis of democratic dissatisfaction included the 10 European countries surveyed (n=7,590). Poland is included in the analysis, though it does not have any populist parties according to our classification (see Appendix B for more information on this). Respondents who answered “Don’t know” or “Refused” to any of the questions were excluded.
After controlling for the independent variables, some factors were not significantly related to democratic dissatisfaction. Agreement with the following statements as good descriptors of their country are not statistically significant: “Most people live in areas where it is dangerous to walk around at night” and “no matter who wins an election, things do not change very much.” Opinions about whether countries should have more or less immigration were not related to dissatisfaction, and neither were favorable views of left-wing populist parties. None of the demographic variables (age, gender and education) were significant predictors of dissatisfaction with democracy.


