
The outcome of the 2016 presidential election surprised a lot of people – not least the many political pollsters and analysts covering it. Today the American Association for Public Opinion Research (AAPOR), the nation’s leading organization of survey researchers, released a long-awaited report that examines polling during last year’s long primary and general election campaigns.
Courtney Kennedy, Pew Research Center’s director of survey research, chaired the AAPOR task force that produced the report. We sat down with Kennedy recently to discuss its findings and recommendations. The conversation has been condensed and edited for clarity and conciseness.
Ever since Donald Trump’s victory over Hillary Clinton last year, there’s been plenty of criticism of the performance and trustworthiness of polls. Was that the impetus for this report?
Actually, this committee was organized back in May 2016, months before any of us had the slightest inkling that last year would be a particularly unusual year for polling. The original intent was pretty straightforward: to evaluate the performance of polls, both in the primary season and the general election; to compare how they did relative to past years; and, to the extent the data would support it, assess whether certain types of polls – online versus telephone, live versus automated – did better or worse than others.
But as of midnight or so on Nov. 8, it was clear that what the committee needed to do had changed. We couldn’t just do this very technical, “what was the average deviation” type of report. We needed to, in addition, consider another question: “Why did the polls seem to systematically underestimate support for Donald Trump?” There already were a number of hypotheses floating around – such as the so-called “shy Trump” effect (Trump supporters being less willing than others to disclose their support to an interviewer), differential nonresponse (Trump supporters being less likely than others to participate in surveys), things of that nature – and we felt obligated to take on that additional piece.
The report notes that, while the national polls generally came pretty close to the actual nationwide popular vote (which Clinton won by 2.1 percentage points over Trump), the performance of polls at the state level – where presidential elections actually are decided – was a lot spottier. What reasons did you find for that?
We found evidence for multiple potential causes. One factor that I think affected everybody who was polling in the battleground states, is the legitimate late change in voter preference in the last week before Election Day. The data on this has its limitations, but the best source is the National Election Pool’s exit poll, which has a question about when voters made up their minds about who to vote for in the presidential race. That showed several roughly 20-point swings in favor of Trump among voters making their mind up in the final week. You didn’t really see that nationally, but in Pennsylvania, Michigan, Wisconsin and even Florida, you saw what looks like dramatic movement.
That’s sort of a good news/bad news finding for pollsters. The good news is, if you interviewed people at a certain point in time and they changed their mind several days later, the poll wouldn’t have detected that. That’s not a flaw in the poll, other than perhaps with the field period in which the pollster decided to do the data collection. But there’s fundamentally nothing that was necessarily off if what was generating most of the error was just honest-to-goodness changes of opinion.
What else did you find at the state level?
Another interesting finding had to do with poll respondents’ level of education. A number of studies have shown that in general, people with higher levels of formal education are more likely to take surveys – it’s a very robust finding. Places like Pew Research Center and others have known that for years, and we address that with our statistical weighting – that is, we ask people what their education level is and align our survey data so that it matches the U.S. population on education. And I think a lot of us assumed that was common practice in the industry – that roughly speaking, everybody was doing it. And that’s not what we found. At the state level, more often than not, the polls were not being adjusted for education.
Now in some elections, such as in 2012, that wouldn’t matter, because the very low educated and the very highly educated voted roughly the same way. But 2016 was drastically different – you had a quite strong linear relationship between education and presidential vote. And that meant that if you had too many college graduates in your poll, which virtually all of us do, and you didn’t weight appropriately, you were almost certainly going to overestimate support for Clinton.
Were there any possible factors for which you didn’t find evidence?
Yes. Take the hypothesis that there’s a segment of the Trump support base that does not participate in polls. If that’s true, that’s a huge problem for organizations like ours, and we need to study that and understand it if we’re ever going to fix it. But we looked for evidence of that, and we didn’t find it.
If it’s true that we’re missing a segment of the Trump support base, we would expect to find – without doing any fancy weighting, just looking at the raw data – that people in more rural, deep-red parts of the country would be underrepresented. And we didn’t find that; if anything, they were slightly overrepresented. We did a number of things with a critical eye looking for those types of problems, and did not find them. And so that gave me real reassurance that fundamentally, it’s not that the process of doing polls was broken last year.
What, if anything, can the profession do to address the issues the committee found with state and local polls, especially given that so many of the newspapers and TV stations that historically sponsored them can no longer afford to do so at the same level?
There’s lots of evidence to show that the resources that news organizations have for polling seem to be declining over time, and that does two things, I think: There are fewer news organizations doing polling, and those that do – particularly local news organizations – are using very low-cost methodology. What the report shows is that there are important design differences among the national polls, which tend to be pretty well resourced, versus the state polls, which tend to be done a lot more quickly using more automated methods with fewer resources. The state polls are half as likely as national polls to have live interviewers, and they’re about half as likely to have adjusted for education in their weighting, which we know to be important. So there are these structural things that seem to have compounded the gap in performance between those state polls and the national polls. We know that on average they’re doing it differently, and in ways that produced greater error in this election. It’s also true that over time, you just see that there’s more error in the state-level polls.
So I could imagine that a professional association like AAPOR might investigate whether this could be addressed, either by professional education or even by trying to organize funding for more rigorous state-level surveys, conducted very close to Election Day, in order to catch people who change their minds late. This would obviously be done by researchers who use very sophisticated, state-of-the-art weighting protocols, so you don’t have things like this education mishap. It’s unclear if that would completely fix the problem, but at least then you’d have an infusion of higher-quality polls into that set of polls that, on average, are done fairly cheaply.
Another piece of the 2016 election cycle was the prominence, even beyond the individual polls themselves, of the data-analysis operations and news sites that aggregated polls and used them not just to predict the final outcome but to give very precise-sounding probabilities that Clinton or Trump would win. How appropriate or useful is it to use polls as predictive tools?
Polls aren’t designed to produce precision on the order of “so-and-so has X.X% chance of winning.” There was actually quite a bit of diversity of opinion on the committee on that issue: Some leaned toward being more aggressive in emphasizing that distinction between the predictors and the pollsters; others less so.
But there is a distinction. Polling and prognosticating really are two different enterprises. A well-done public opinion survey can tell you what opinion was during the time that interviewing was done, but that really doesn’t speak in a precise way to future behavior. It’s been said before, but it bears repeating: A poll is a snapshot in time, not a way of predicting what will happen. As we say in the report, greater caution and humility would seem to be in order for anyone making claims about the likely outcome of an election based in part or in whole on polling data.
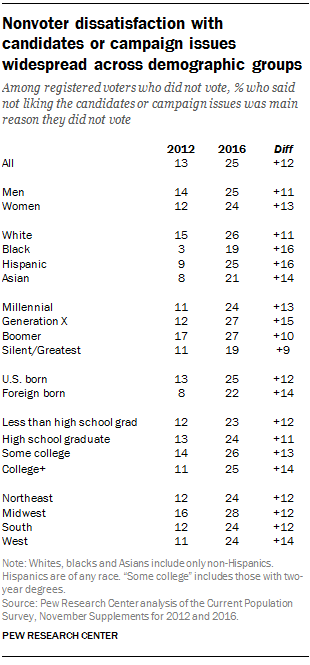
Where polls can be useful is in helping answer important questions about what is motivating voters, why people are voting or not voting, how they feel about the policies being debated, how they feel about the candidates themselves. All of those questions are more than deserving of serious answers, and that’s what polls are really best designed to do.
So, can polls still be trusted despite what happened last year?
I believe they can. First off, it’s worth pointing out that the performance of election polls isn’t a good indicator of the quality of surveys in general. Election polls differ from other types of surveys in some key ways: Not only do they have to field a representative sample of the public, but they also have to correctly model who among that sample will actually vote. That’s a very difficult task that non-election polls simply don’t have.
It’s important to dispel the notion that polling writ large is broken – our investigation found that not to be the case. At the same time, we shouldn’t whitewash what happened. There were errors, and the polling industry has taken a reputational hit. But the polling community and poll consumers should take some comfort in the fact that we’ve figured out quite a bit about what went wrong and why, and we all can learn from those errors. Some things were outside of pollsters’ control, namely the late shifts in voter preference; other things were in their control and are fixable. The education imbalance, for example, is very fixable.
We as researchers should be talking about the whole story of polling in 2016 – the differences between the national polls and state polls, the fact that we’ve identified major factors that led to the errors – in an open, non-defensive way, to dispel the “polling is broken” narrative. That narrative does a disservice to our democracy. Because polling, imperfect as it is, remains the best available tool for measuring the attitudes of all Americans. And when it’s done well, it can still produce very useful data. No matter which party is in power, it’s important to have independent, objective researchers measuring how the public feels about major issues of the day.
