This report is based on two different data sources: a representative survey of U.S. parents and Reddit data from the r/Parenting subreddit.
The American Trends Panel survey methodology
Overview
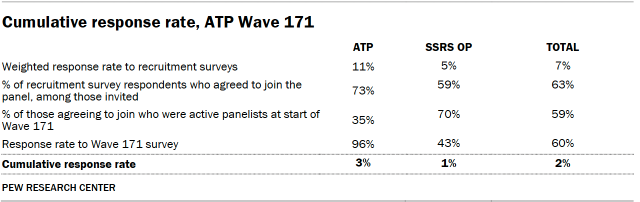
Data in this report comes from Wave 171 of the American Trends Panel (ATP), Pew Research Center’s nationally representative panel of randomly selected U.S. adults. The survey was conducted from May 13 to 26, 2025, among a sample of adults who are parents or guardians of any child age 12 or under. A total of 3,054 eligible parents responded out of 6,287 who were sampled, for a survey-level response rate of 60% (AAPOR RR3).2 This includes 1,697 respondents from the ATP and an additional 1,357 from the SSRS Opinion Panel (OP).
The cumulative response rate accounting for nonresponse to the recruitment surveys and attrition is 2%. The break-off rate among panelists who logged on to the survey and completed at least one item is 1%. The margin of sampling error for the full sample of 3,054 respondents is plus or minus 2.2 percentage points.
SSRS conducted the survey for Pew Research Center via online (n=2,935) and live telephone (n=119) interviewing. Interviews were conducted in both English and Spanish.
To learn more about the ATP, read “About the American Trends Panel.”3
Panel recruitment
Since 2018, the ATP has used address-based sampling (ABS) for recruitment. A study cover letter and a pre-incentive are mailed to a stratified, random sample of households selected from the U.S. Postal Service’s Computerized Delivery Sequence File. This Postal Service file has been estimated to cover 90% to 98% of the population.4 Within each sampled household, the adult with the next birthday is selected to participate. Other details of the ABS recruitment protocol have changed over time but are available upon request.5 Prior to 2018, the ATP was recruited using landline and cellphone random-digit-dial surveys administered in English and Spanish.
A national sample of U.S. adults has been recruited to the ATP approximately once per year since 2014. In some years, the recruitment has included additional efforts (known as an “oversample”) to improve the accuracy of data for underrepresented groups. For example, Hispanic adults, Black adults and Asian adults were oversampled in 2019, 2022 and 2023, respectively.
Sample design
The overall target population for this survey was noninstitutionalized persons ages 18 and older living in the United States who are the parent or guardian of any child 12 or under. All active ATP members who had previously indicated they were the parent or guardian of any child 12 or under were invited to participate in this wave.
The ATP was supplemented with a sample from SSRS’s Opinion Panel. For the OP sample, SSRS took a probability proportional to size (PPS) sample of OP panelists with children 0 to 17 years, then screened respondents for selection. Only OP panelists who were parents or guardians of any child 12 or under were screened into the survey.
At the start of the survey, potentially eligible respondents were asked a series of screening questions to confirm their eligibility to complete the survey. For the ATP and OP samples, respondents were considered eligible if they indicated they were the parent or guardian of any child 12 or under.
Questionnaire development and testing
The questionnaire was developed by Pew Research Center in consultation with SSRS. The web program used for online respondents was rigorously tested on both PC and mobile devices by the SSRS project team and Center researchers. The SSRS project team also populated test data that was analyzed in SPSS to ensure the logic and randomizations were working as intended before launching the survey.
Incentives
All respondents were offered a post-paid incentive for their participation. ATP and OP respondents may receive the post-paid incentive in the form of a check or gift code to online merchants such as Amazon.com, Target.com or Walmart.com. Incentive amounts ranged from $5 to $15 for ATP respondents, and $5 to $10 for OP respondents, depending on whether the respondent belongs to a part of the population that is harder or easier to reach. Differential incentive amounts were designed to increase panel survey participation among groups that traditionally have low survey response propensities.
Data collection protocol
The data collection field period for this survey was May 13 to 26, 2025. Surveys were conducted via self-administered web survey or by live telephone interviewing.
For panelists who take surveys online:6 Postcard notifications were mailed to a subset of ATP panelists on May 12.7 Survey invitations were sent out in two separate launches: soft launch and full launch. 427 panelists were included in the soft launch (60 from ATP, 367 from OP), which began with an initial invitation sent on May 13. All remaining English- and Spanish-speaking sampled online panelists were included in the full launch and were sent an invitation on May 14.

Panelists participating online were sent an email invitation. ATP panelists received up to four email reminders if they did not respond to the survey, and OP panelists received up to two email reminders if they did not respond to the survey. ATP panelists who consented to SMS messages were sent an SMS invitation with a link to the survey and up to four SMS reminders. SSRS panelists who consented to SMS messages were sent an SMS invitation with a link to the survey and up to two SMS reminders.
For panelists who take surveys over the phone with a live interviewer: Prenotification postcards were mailed to ATP panelists on May 9. Soft launch took place on May 13 and involved dialing until a total of four interviews had been completed. All remaining English- and Spanish-speaking sampled phone panelists’ numbers were dialed throughout the remaining field period. Panelists who take surveys via phone can receive up to six calls from trained SSRS interviewers.
Data quality checks
To ensure high-quality data, Center researchers performed data quality checks to identify any respondents showing patterns of satisficing. This includes checking for whether respondents left questions blank at very high rates or always selected the first or last answer presented. As a result of this checking, no respondents were removed from the survey dataset prior to weighting and analysis.
Weighting
The ATP data is weighted in a process that accounts for multiple stages of sampling and nonresponse that occur at different points in the panel survey process. First, each panelist begins with a base weight that reflects their probability of recruitment into the panel. Base weights for OP respondents were provided by SSRS. The base weights for ATP and OP respondents were combined and scaled to account for the sample design.
The combined base weights were calibrated to align with the following estimated benchmarks for the population of parents or guardians of children ages 12 and under: age, gender, education, race/ethnicity, years living in the U.S. (among foreign born), volunteerism, voter registration, frequency of internet use, religious affiliation, party affiliation, census region, metropolitan status, the number of children ages 0 to 4, the number of children ages 5 to 12, and the number of children ages 13 to 17.
Because there are no official benchmarks for this population, weighting parameters were estimated using the eligible respondents to Wave 171 from the ATP sample. First, all ATP respondents who completed the screening questions on Wave 171, regardless of final eligibility, were weighted to match the full set of ATP members who were sampled on the following dimensions: age, gender, education, race/ethnicity, years living in the U.S. (among foreign born), volunteerism, voter registration, frequency of internet use, religious affiliation, party affiliation, census region and metropolitan status. These weights were then used to calculate weighting parameters based only on ATP respondents to Wave 171 who screened as eligible.
In the final step, the weights were trimmed at the 1st and 99th percentiles to reduce the loss in precision stemming from variance in the weights. Sampling errors and tests of statistical significance take into account the effect of weighting.
The following table shows the unweighted sample sizes and the error attributable to sampling that would be expected at the 95% level of confidence for different groups in the survey.

Sample sizes and sampling errors for other subgroups are available upon request. In addition to sampling error, one should bear in mind that question wording and practical difficulties in conducting surveys can introduce error or bias into the findings of opinion polls.
Dispositions and response rates

How family income tiers are calculated
Family income data reported in this study is adjusted for household size and cost-of-living differences by geography. Panelists then are assigned to income tiers that are based on the median adjusted family income of all American Trends Panel members. The process uses the following steps:
- First, panelists are assigned to the midpoint of the income range they selected in a family income question that was measured on either the most recent annual profile survey or, for newly recruited panelists, their recruitment survey. This provides an approximate income value that can be used in calculations for the adjustment.
- Next, these income values are adjusted for the cost of living in the geographic area where the panelist lives. This is calculated using price indexes published by the U.S. Bureau of Economic Analysis. These indexes, known as Regional Price Parities (RPP), compare the prices of goods and services across all U.S. metropolitan statistical areas as well as non-metro areas with the national average prices for the same goods and services. The most recent data available at the time of the annual profile survey is from 2022. Those who fall outside of metropolitan statistical areas are assigned the overall RPP for their state’s non-metropolitan area.
- Family incomes are further adjusted for the number of people in a household using the methodology from Pew Research Center’s previous work on the American middle class. This is done because a four-person household with an income of say, $50,000, faces a tighter budget constraint than a two-person household with the same income.
- Panelists are then assigned an income tier. “Middle-income” adults are in families with adjusted family incomes that are between two-thirds and double the median adjusted family income for the full ATP at the time of the most recent annual profile survey. The median adjusted family income for the panel is roughly $74,100. Using this median income, the middle-income range is about $49,400 to $148,200. Lower-income families have adjusted incomes less than $49,400 and upper-income families have adjusted incomes greater than $148,200 (all figures expressed in 2023 dollars and scaled to a household size of three). If a panelist did not provide their income and/or their household size, they are assigned “no answer” in the income tier variable.
Two examples of how a given area’s cost-of-living adjustment was calculated are as follows: the Pine Bluff metropolitan area in Arkansas is a relatively inexpensive area, with a price level that is 19.1% less than the national average. The San Francisco-Oakland-Berkeley metropolitan area in California is one of the most expensive areas, with a price level that is 17.9% higher than the national average. Income in the sample is adjusted to make up for this difference. As a result, a family with an income of $40,400 in the Pine Bluff area is as well off financially as a family of the same size with an income of $58,900 in San Francisco.
The respondents from the SSRS Opinion Panel oversample answered the same family income and household size questions, and their incomes were adjusted using the procedures detailed above. They were then assigned an income tier based on the median adjusted family income for the full ATP at the time of the most recent annual profile survey.
Reddit data collection and analysis
This report analyzes posts and comments from the r/Parenting forum on Reddit. It is based on a total of 29,295 posts (also known as “submissions”) and 853,209 comments posted on r/Parenting from Jan. 17 to July 17, 2025. Post and comment text were classified using OpenAI’s GPT-4.1 mini model. Details about data collection, classification and model performance are discussed below.
Reddit data collection
Reddit posts, comments and engagement metrics from the r/Parenting subreddit were collected using requests to the official Reddit Data API. We ran the Reddit data collection pipeline on an hourly schedule from Jan. 17 to July 17, 2025. Each hour, we collected the following:
- All Reddit submissions posted to r/Parenting in the past hour, including the submission author, title and body text. We also collected metadata such as the time it was posted and the tag used to categorize the post (known as a “flair” on Reddit).
- Comments on all Reddit submissions posted to r/Parenting 48 hours earlier, including the comment text, author and upvote count. We also collected metadata such as the time it was posted and whether the comment was a reply to the original post or a reply to another comment.
- Engagement metrics for all Reddit submissions posted to r/Parenting 48 hours earlier, including the number of comments, upvote score (number of upvotes minus downvotes) and upvote ratio (the ratio of upvotes to total votes).
For example, let’s say a submission was posted to r/Parenting on Jan. 17 at 7:40 a.m. This post would be automatically collected at the next scheduled hourly collection (8:00 a.m.), and its comments and engagement metrics would be collected at the hourly collection 48 hours later (8:00 a.m. on Jan. 19).
On Feb. 21, two hours of data collection were disrupted by a brief sitewide Reddit outage.
A Reddit submission status audit was conducted about nine months after the start of our data collection period. On Oct. 16, 2025, we made a request to the Reddit Data API for every submission in our original dataset to check whether the submission status was active, deleted or removed.
Language and time zone of r/Parenting posts and comments
Over 99% of posts in r/Parenting are written in English. English language was detected for all posts using the stringi R package’s function for detecting character set and language, with an English confidence cutoff of 0.3.
Additionally, the subreddit is most active during the daytime in U.S. time zones. Based on the timestamps available for the submissions and comments in our dataset, the most common times to post were between 10 a.m. and 2 p.m. Eastern time. Meanwhile, the least common times to post were between 2 a.m. and 6 a.m. Eastern time.
Post classification
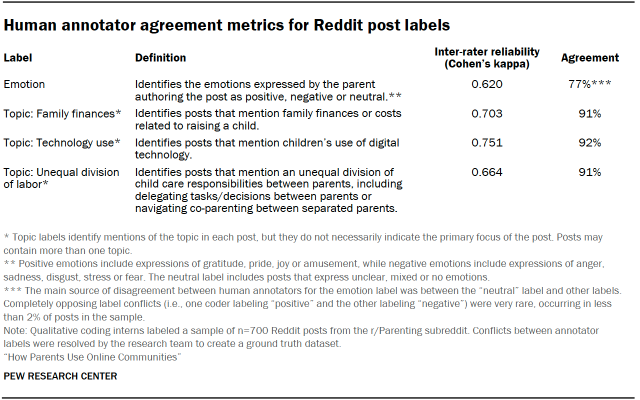
To better understand discourse on r/Parenting, each Reddit post in our dataset was classified based on the emotions expressed and topics mentioned in the post. Researchers worked with qualitative coding interns to develop a codebook that describes these categories and accurately reflects some themes that commonly appear in posts on r/Parenting.
After finalizing the category labels and definitions, two qualitative analysis interns labeled a sample of 700 Reddit posts. Due to the relatively sparse occurrence of some labels, this sample included a random sample of posts and an oversample of posts that contained relevant keywords or flairs. The validation dataset of 700 posts included the following balance of class labels:
- Emotion label: 337 negative, 89 positive and 274 neutral posts
- Topic labels:
- 148 posts that mention family finances, 552 that do not
- 120 posts that mention unequal division of labor, 580 that do not
- 146 posts that mention children’s technology use, 554 that do not
A summary of the labels, their definitions and an inter-rater reliability metric are available in the table below. In the case of conflicts between coders, a member of the research team selected a winning label for the final ground truth dataset.
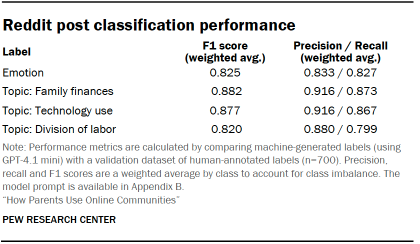
After labeling the validation dataset of 700 Reddit posts, we used OpenAI’s GPT-4.1 mini model to classify all 29,295 Reddit posts in the full dataset. For each post, we prompted the model with annotation instructions, a description of each label (taken from the codebook used by human annotators), and the title and body of the Reddit post. For six posts in the dataset, the model did not provide a valid label; these six posts were included in our analysis with an “unknown” label, but the unknown share rounded to 0% for all calculations. The full model prompt text is available in Appendix B. The model’s performance metrics are available in the table below.
Comment classification
In addition to Reddit posts, we also classified comments to learn more about the community of commenters on r/Parenting. In the six-month data collection period, we collected a total of 853,209 comments replying to the set of 29,295 posts. As noted in the data collection section above, our comment dataset only includes comments that were posted within 48 hours of the original post.
We observed that many posts in r/Parenting include explicit requests for advice, information or sympathy, and discourse on the subreddit largely takes place in the comments that respond and react to these posts. To assess the community response to posts on r/Parenting, we classified a comment as “supportive” if it thoughtfully or helpfully replies to the original post. This includes comments that offer helpful advice, respond to a question posed in the post or otherwise contribute positively to the community discussion.
It should be noted that by this definition, “supportive” does not require that the comment agrees with the original post; for example, constructive criticism or a respectful disagreement still counts as supportive if it contributes positively to the conversation and replies helpfully to the original post. On the other hand, comments that have a disrespectful tone, criticize the original post or author, are off-topic, or are difficult to interpret would be classified as “not supportive.”
For this comments analysis, we focused only on comments that replied directly to the original post, also known as top-level comments. Since a Reddit comment may be posted as a reply to other comments, it is common for lengthy comment threads to develop into discussions that may be only adjacently related to the original post.
Out of the 853,209 comments in our full dataset, 475,311 of those comments were valid top-level comments. Valid top-level comments include comments that satisfy the following criteria:
- The comment replies to the original post, rather than replying to another comment.
- The comment author is not the same user as the original post author.
- The comment author is not a r/Parenting subreddit moderator (i.e., the author username is not “AutoModerator” or “Parenting-ModTeam”).
- The comment was not deleted by the user or removed by Reddit.
To create a ground truth dataset for comment classification, two qualitative coding interns labeled a sample of 1,005 top-level comments as “supportive” or “not supportive.” Due to the sparse occurrence of unsupportive comments, this sample included a random sample of comments and an oversample of comments that were likely to be not supportive. The oversample of likely unsupportive comments was selected using an early version of the classification prompt to a large language model.
The qualitative coders reached 92% agreement on the comments ground truth dataset (Cohen’s kappa = 0.624). In the case of conflicts between coders, a member of the research team selected a winning label for the final validation dataset. The validation dataset of 1,005 posts included 881 supportive comments and 124 unsupportive comments.
We used OpenAI’s GPT-4.1 mini model to classify all 475,311 valid top-level comments in the full dataset. For each request to the model, the input prompt included annotation instructions and a description of the “supportive” and “not supportive” label. It also included the Reddit post text and the text of up to five corresponding comments to be classified. The full model prompt text is available in Appendix B. Based on the human-annotated ground truth dataset, the model achieved 87% accuracy, with a weighted average F1 score of 0.876, precision score of 0.886 and a recall score of 0.868. Of all 475,311 valid top-level comments in the dataset, 102 comments could not be classified due to errors parsing the model output.