
June 26, 2025, marks 10 years since the Supreme Court ruled in Obergefell v. Hodges that the right to same-sex marriage is guaranteed across the United States.
The decision, which represented a major change in U.S. family law, reflected shifting public opinion on same-sex marriage. In 2004, 31% of Americans supported it, while 60% opposed. By 2015, 55% supported same-sex marriage, while 39% opposed. And support has continued to grow: In 2023, 63% of Americans expressed support for same-sex marriage.
To explore how lesbian, gay, bisexual, transgender and queer adults see the impact of Obergefell, and how they view social acceptance for these groups more broadly, we surveyed 3,959 LGBTQ adults from Jan. 8 to Jan. 19, 2025.
This study, which builds on a similar Pew Research Center survey conducted in 2013, also looks at the experiences of LGBTQ adults at a time when many in these groups see the political climate as unfavorable, especially for transgender people.
In broad strokes, the survey finds some sense of social progress, as well as a feeling that acceptance will continue to grow. But it also highlights experiences with discrimination, especially among transgender adults. And it underscores the diversity of experiences across and within LGBTQ groups – from coming out, to navigating public spaces, to connecting with a broader LGBTQ community.
Related: Same-Sex Parents Raising Kids
Key findings
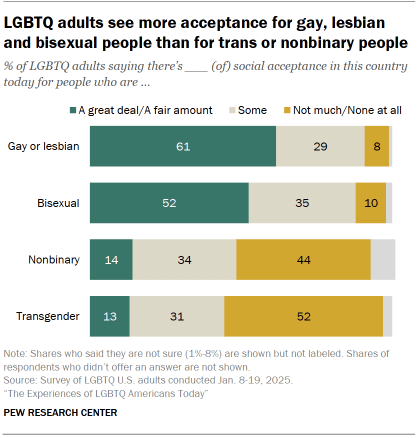
LGBTQ adults have mixed views on how much social acceptance there is for certain groups.
- 61% of LGBTQ adults say there’s at least a fair amount of acceptance for people who are gay or lesbian. About half (52%) say the same for people who are bisexual. Far fewer say there’s a great deal or fair amount of acceptance for people who are nonbinary (14%) or transgender (13%).
- Most LGBTQ adults say there is more acceptance today compared with 10 years ago for each of these groups. And majorities expect there to be even more acceptance 10 years from now.
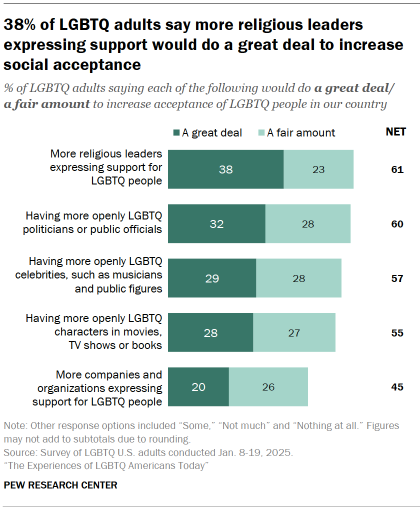
- In thinking about what might increase acceptance, many LGBTQ adults point to more support from religious leaders and to greater representation in politics and entertainment. Fewer see a lot of value in corporations or organizations expressing support for LGBTQ people.
Related: About two-thirds of LGBTQ adults have participated in Pride Month events
Two-thirds of LGBTQ adults say the Obergefell decision made people more accepting of same-sex couples.
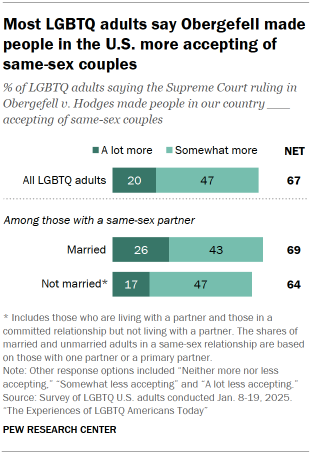
- This includes 47% who say the Supreme Court ruling made people somewhat more accepting and 20% who say it made people a lot more accepting.
- LGBTQ adults who are in a same-sex marriage are more likely than those who are in a same-sex relationship but not married to say the ruling made people a lot more accepting (26% vs. 17%).
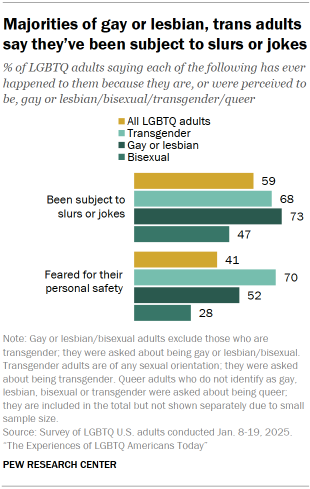
Majorities of gay or lesbian adults (73%) and transgender adults (68%) say they have been subject to slurs or jokes because of their sexual orientation or gender identity.
- Transgender adults are about twice as likely as gay or lesbian adults to say this has happened to them recently – that is, in the 12 months prior to the survey (42% vs. 22%).
- 70% of transgender adults say they have feared for their personal safety at some point. About half of gay or lesbian adults (52%) and 28% of bisexual adults say the same.
- Among LGBTQ adults overall, 24% say they have received poor service at stores or restaurants, 21% say they have been treated poorly by doctors or nurses, and 19% say they have been treated unfairly by an employer because of their sexual orientation or gender identity.
- Transgender adults are more likely than others to say they have been treated poorly by health care professionals (42% vs. 24% of gay or lesbian adults and 16% of bisexual adults).
Many LGBTQ adults say they were first aware of their sexual orientation or gender identity at an early age but didn’t tell anyone until later.
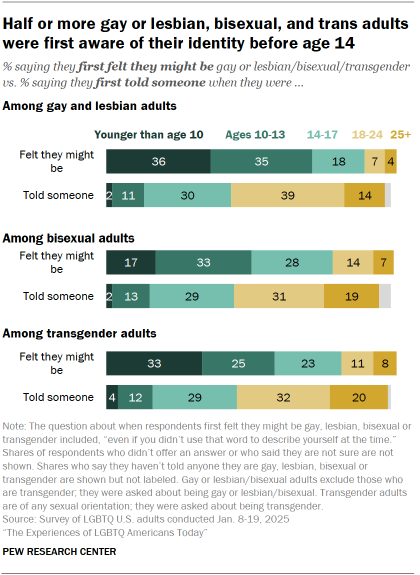
- 71% of gay or lesbian adults, 50% of bisexual adults, and 58% of transgender adults say they were first aware of their identity before age 14. Much smaller shares say they had told someone about it by that age.
- Among gay or lesbian adults, men are more likely than women to say they first felt they might be gay at age 13 or younger (78% vs. 53%). But men and women respond similarly when asked at what age they first came out to someone.
- The opposite is true among bisexual adults: Women are more likely than men to say they first thought they might be bisexual at age 13 or younger (53% vs. 39%). Bisexual women are also much more likely than bisexual men to say they came out to someone before age 18 (50% vs. 24%).
Younger gay, lesbian and bisexual adults tend to say they came out at an earlier age compared with their older counterparts.
- 67% of gay or lesbian adults under 30 say they came out to someone before age 18. Smaller shares in their 30s (53%), 40s (37%), 50s (32%) or ages 60 and older (24%) say the same.
- Similarly, 56% of bisexual adults under 30 say they first came out before age 18, but fewer than half in older age groups report doing so.
Bisexual adults are more likely than gay, lesbian and transgender adults to say they haven’t come out to any of their family, friends or co-workers.
- For example, 47% of bisexual adults say they’re not out to any of their extended family. This compares with 26% of transgender adults and 13% of gay or lesbian adults.
- Overall, 32% of LGBTQ adults say no one in their extended family knows they are gay, lesbian, bisexual, transgender or queer. About a quarter (23%) say their parents or the people who raised them don’t know. And 25% say none of their co-workers know (among those who are employed and have co-workers).
- Smaller shares say none of their siblings (18% among those who have siblings) or none of their friends (5%) know about this part of their identity.
Gay or lesbian adults are more likely than bisexual and trans adults to say their family members have been accepting of their identity.
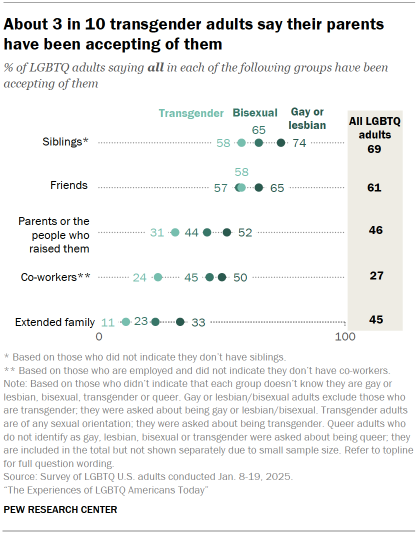
- 74% of gay or lesbian adults say all of their siblings have been accepting (among those who have siblings). Smaller shares of bisexual (65%) and transgender (58%) adults say the same.
- Gay or lesbian adults are also more likely than others to say this about their parents or the people who raised them, and about their extended family.
- A majority of LGBTQ adults (61%) say all of their friends have been accepting of them.
About four-in-ten LGBTQ adults (42%) say their sexual orientation or gender identity is highly important to who they are as a person.
- 67% of transgender adults say being trans is extremely or very important to who they are. Smaller shares of gay or lesbian adults (54%) and bisexual adults (29%) say this about their own identity.
- LGBTQ adults who are Black (48%) or Hispanic (47%) are more likely than those who are White (39%) to say their LGBTQ identity is highly important to who they are. (There aren’t enough Asian LGBTQ adults in the sample to analyze their views separately.)
About a quarter of LGBTQ adults (23%) say they feel extremely or very connected to a broader LGBTQ community, but this varies by group.
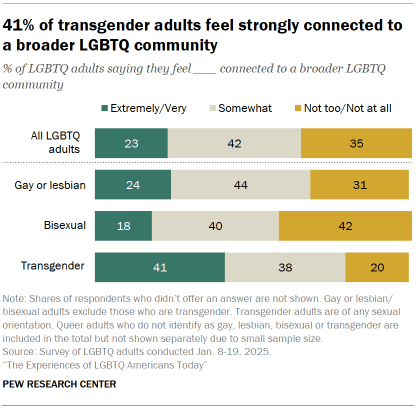
- 41% of transgender adults feel this level of connection, compared with 24% of gay or lesbian adults and 18% of bisexual adults.
- 63% of transgender adults also say all or most of their friends are LGBTQ. This is far greater than the shares of gay or lesbian adults (30%) and bisexual adults (20%) who say the same.
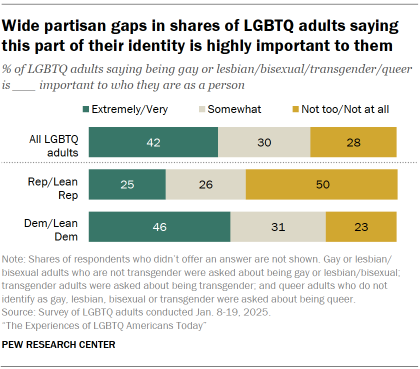
Some views and experiences of LGBTQ adults vary by party.
- LGBTQ adults who are Democrats or lean Democratic are more likely than Republicans and Republican leaners to say Obergefell made people more accepting of same-sex couples (70% vs. 55%).
- 46% of LGBTQ Democrats say being gay, lesbian, bisexual, transgender or queer is extremely or very important to who they are as a person. This compares with 25% of LGBTQ Republicans.
- LGBTQ Democrats are more likely than their Republican counterparts to say all or most of their friends are LGBTQ (31% vs. 13%).
- Overall, 80% of LGBTQ adults are Democrats and 16% are Republicans.
About half of gay or lesbian adults say they have at least a fair amount in common with most bisexual or straight people.
- Majorities of gay or lesbian (77%), bisexual (71%), and transgender (74%) adults say they have a great deal or a fair amount in common with most others in their own group.
- About half of gay and lesbian adults say they have a great deal or a fair amount in common with bisexual people (50%) and straight people (51%). A smaller share (28%) say they have a lot in common with transgender people.
- Bisexual adults are more likely than gay or lesbian adults to say they have at least a fair amount in common with straight people (61% vs. 51%). A quarter say they have at least a fair amount in common with transgender people.
- Most transgender adults say they have a lot in common with gay, lesbian and bisexual people. But it’s important to note that 28% of trans adults themselves identify as gay or lesbian, and 53% identify as bisexual.
LGBTQ adults tend to be young, and that’s especially true of transgender adults.
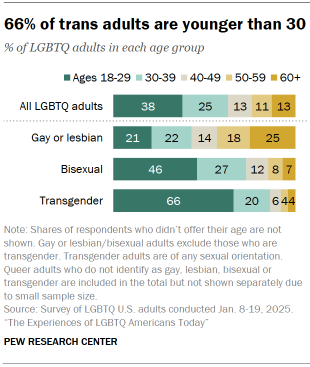
- The median age of LGBTQ adults is 34, versus 47 for all U.S. adults.1
- Overall, 38% of LGBTQ adults are ages 18 to 29, and 25% are in their 30s. Only 13% are ages 60 and older.
- 66% of transgender adults are younger than 30. This compares with 46% of bisexual adults and 21% of gay or lesbian adults.
- In turn, 25% of gay or lesbian adults are ages 60 and older, while just 7% of bisexual adults and 4% of transgender adults are in this age group.
Half of all LGBTQ adults are women, 40% are men and 8% are nonbinary.
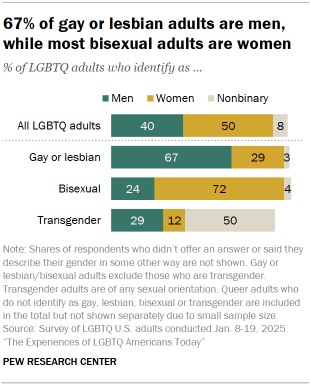
- Men account for 67% of gay or lesbian adults. The gender composition looks different among bisexual adults: 72% are women.
- Among trans adults, more are men (29%) than are women (12%). The largest share (50%) are nonbinary, while 8% describe their gender in some other way.
Jump to read more about:
- Changing acceptance of LGBTQ people
- Acceptance by family, friends and co-workers, and experiences with discrimination
- Coming out
- LGBTQ identities
- Community, friends and LGBTQ spaces
CORRECTION (Sept. 11, 2025): In a previous version of the chart “About 3 in 10 transgender adults say their parents have been accepting of them,” the shares of all LGTBQ adults who say all their co-workers are accepting and all their extended family are accepting were transposed. This has been updated, and the report’s findings are not affected.


