
Over the past four decades, the American middle class has been shrinking relative to upper- and lower-income groups, both of which represent bigger shares of the population than at any time since at least 1971, a new Pew Research Center report finds.
Which raises the question: Which industries and occupations are more likely to offer opportunities for middle- and upper-income jobs? A follow-up analysis finds that, as you might expect, the upper-income tier has grown the most in the financial and natural-resources industries (think oil and gas), and among executives and managers. At the same time, the lower-income tier increased the most among retail sales workers and “operators,” a grouping of mostly blue-collar manufacturing-type jobs.
We reanalyzed the Census data underpinning the middle income report to examine the evolving income structures of 14 broad occupational groupings and 16 industrial sectors. As in that report, “middle income” is defined here as households making between two-thirds and double the median household income; “upper income” is defined as more than twice the median, and “lower income” as less than two-thirds of it. (The components of the industry and occupational groupings can be found here.)
This post looks at employed adults, not all adults, as in the original report. Among employed adults overall, 55% lived in middle-income households last year, down from two-thirds in 1971. The share of employed adults in upper-income households rose from 18% to 27%; the share in lower-income households edged higher, from 16% to 18%.
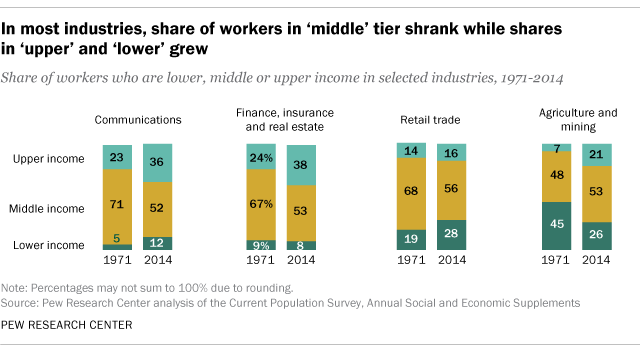
Our analysis found that fully 38% of the employed adults in the finance, insurance and real estate sector (commonly called FIRE) qualified as upper income last year, the highest level of any sector. FIRE, which accounts for about 7% of all employed adults, also was the industry that experienced the greatest growth in the upper-income tier: 14.5 percentage points between 1971 and 2014. Over the same period, FIRE’s middle-income tier shrank from 67% of the sector to 53%.
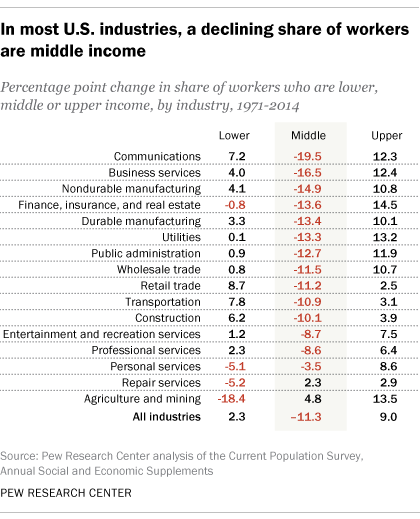
In none of the 16 industrial sectors, by the way, did the upper-income tier shrink in the 1971-2014 study period. However, in three sectors upper-income gains were outweighed by increases in the lower-income tiers: construction, transportation and retail.
The smallest growth was in retail, which accounts for about 17% of all employed adults: Retail’s upper-income tier grew just 2.5 percentage points, from 14% to 16%. Perhaps not coincidentally, retail also showed the biggest increase in the lower-income tier: 8.7 percentage points. Last year, 28% of people working in retail were lower income (that is, living in households with less than two-thirds of the adjusted median household income); that was the second-highest level of any sector. (The highest was personal services, at 31%.)
Perhaps the most dramatic example of upward mobility could be found in the agriculture and mining sector, which employs about 3% of working adults, including those in oil and gas extraction, forestry and fishing. In 1971, 45% of adults employed in this sector were lower income, 48% were middle income and just 7% were upper income; by 2014, those percentages were 26%, 53% and 21% respectively. Agriculture and mining had both the biggest lower-income decrease and the biggest middle-income increase of any sector we studied.
Turning to occupations, executives and managers (who make up 15% of all employed adults) fared the best over the past four decades. Nearly half (47%) of that group were in the upper-income tier last year, a 17-percentage-point increase from those positions’ share in 1971. The only occupational groups with bigger upper-income shares in 2014 were “professional specialties” (a group of mostly scientists and engineers), at 51%, and medical professionals, at 48%.
On the flip side, the operators group (comprised primarily of machine operators, equipment assemblers and other manufacturing jobs, and accounting for 4% of employed adults) were the most likely to experience a shift downward: Lower-income workers made up 24% of that group’s workers last year, up from 16% in 1971.
A heterogeneous group of service occupations (including, among many others, housekeepers, janitors, waitstaff, child care workers and hairdressers, together accounting for almost 14% of employed adults) had the biggest low-income tier of any occupational grouping: 37%.
One of the smaller occupational groupings – farming, forestry and fishing, accounting for about 2.5% of employed adults – had both the biggest shrinkage of its lower-income tier and the biggest increase in middle-income workers. The lower-income tier shrank from 52% in 1971 to 35% in 2014, while the middle-income tier grew from 43% to 51% over the same period.
The authors of the middle income report note that those improvements “occurred in the context of an industry that has steadily improved productivity and wages as it moved from small, labor-intensive farms to large, mechanized and more specialized farms.” Nonetheless, the researchers point out, “farming and fishing occupations were about twice as likely to be lower income and about half as likely to be upper income as employed adults overall.”
Related: Are you in the American middle class? Find out with our income calculator.
