
Economic inequality is in the news in a way it hasn’t been for a long time. Thomas Piketty’s book Capital in the 21st Century, which argues that the innate dynamics of capitalism cause income gaps to widen, has become a surprise best-seller (so much so that Amazon listed it as “temporarily out of stock”). President Obama has called for raising the federal minimum wage as one measure to help narrow inequality, but in the absence of Congressional action, many states and cities are raising their own (or at least putting the question on this fall’s ballots). And, as The New York Times reported this week, the American middle class is no longer the world’s most affluent.
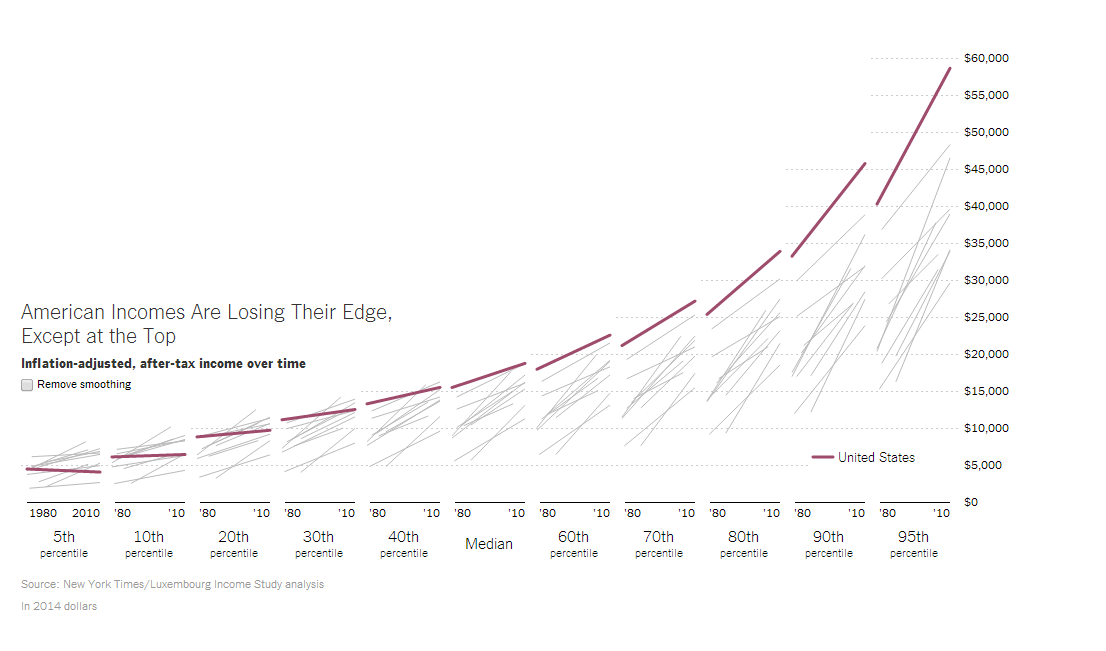
This week’s chart of the week (our screenshot doesn’t capture the interactive version) shows how after-tax incomes at different levels grew between 1980 and 2010 in the U.S. and 10 other advanced economies. (The data come from the Luxembourg Income Study Database.) Besides showing how steep income growth was at the upper levels relative to the lowest ones, the graphic shows how much different tiers of Americans have fallen behind their peers in other countries.
For instance, Americans in the 20th income percentile earned less in 2010 than Norwegians, Canadians, Dutch, Germans, Swedes and Finns in those countries’ respective 20th percentiles. Three decades earlier, 20th-percentile Americans earned more than everyone except Canadians. American and Canadian median per capita incomes were about equal in 2010, at $18,700, according to the LIS data. But other, more recent income surveys, “suggest that since 2010 pay in Canada has risen faster than pay in the United States and is now most likely higher,” the Times wrote.
But the American rich still make considerably more than other countries’ rich. At the 95th percentile, U.S. per-capita income was nearly $60,000, more than $10,000 ahead of Canada’s top earners.
