Four years into the current recovery, the views of most Americans about the economy can be summed up as “meh.” According to a Pew Research Center survey conducted last week, 45% of Americans rate the national economy as “only fair,” and 37% call its condition “poor”; only 17% were willing to say the economy is in “excellent” or “good” shape. And a plurality, 44%, say it will be a long time before the economy recovers.
Those tepid-to-glum attitudes have persisted despite some encouraging trends at the macro level: Unemployment is down, stocks are up, inflation is tame, and GDP growth is, if not all that impressive, at least running ahead of most other industrialized countries. But at the level where most people actually live their lives, what improvement there’s been hasn’t erased the Great Recession’s sting.
As President Obama tries to refocus both the government and the public on economic concerns, we decided to take a look at the “real-world” economy through five lesser-known, but arguably more revealing, indicators:

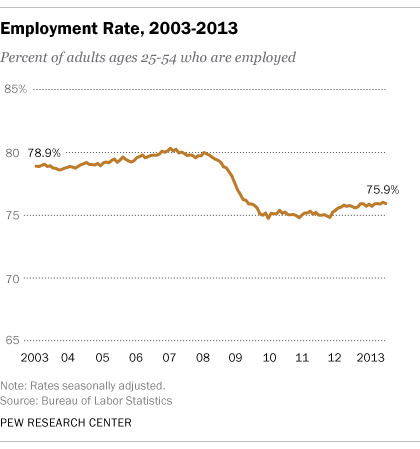
Unlike the unemployment rate, which can be affected by how many jobless people actively look for work, the employment-to-population ratio (sometimes called the employment rate) looks at employed adults as a share of the total civilian noninstitutional population; examining just 25- to 54-year-olds takes out most students and retirees. Despite some recent improvement, the June employment rate of 75.9% is still well below pre-recession levels, which typically were close to or above 80%. And the flatness in the rate indicates the economy isn’t doing much more than adding enough jobs to keep up with population growth.
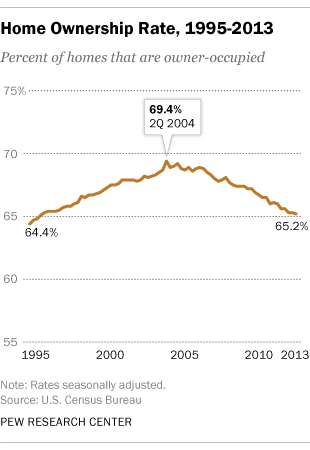

Home ownership was on the rise well before the mortgage mania of the mid-2000s, aided by falling interest rates and government policies designed to encourage it. But the bursting of the bubble and the wrenching recession that followed forced tens, if not hundreds, of thousands of families to lose their homes; home ownership now is down to levels not seen since the mid-1990s. The bust’s impact was particularly severe on non-whites: While home ownership among non-Hispanic whites is 2.8 percentage points below its peak, home ownership among blacks is down 6.6 percentage points to 43.1%, and down 6 percentage points among people of all other races, to 54.6%. Among Hispanics, home ownership has fallen to 45.3% in the first quarter of this year from 50.1% in the third quarter of 2007.


Although early withdrawals from retirement accounts increased during the Great Recession and its aftermath, the difference was less than what one might have expected — largely, researchers from the Federal Reserve and the IRS found, because early withdrawals were so substantial in the years leading up to the recession. The data suggest that many families were under financial stress even during the apparently prosperous years of the mid-2000s.
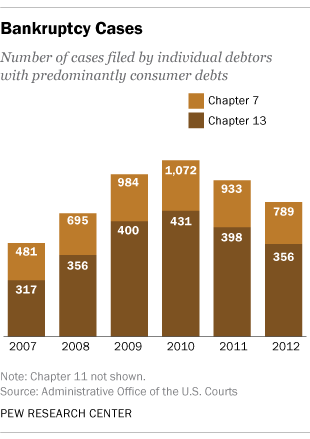

When financial stress becomes too much to bear, bankruptcy becomes an option. Individual (non-business) bankruptcy filings surged during the Great Recession — largely due to sharp increases in Chapter 7 (liquidation) filings. Though individual bankruptcy filings have fallen since 2010, they remain well above pre-recession levels.
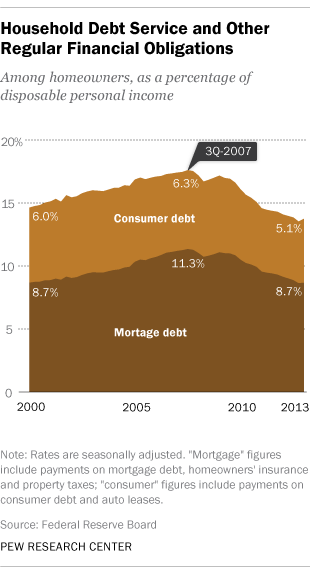

One bright spot: Household debt is taking up less of people’s disposable income, as mortgage balances and credit-card balances continue to fall. Student-loan balances, though, are on the rise — up $20 billion in the first quarter of 2013, to a total of $986 billion. Since the second quarter of 2010, student loans have constituted the second-biggest category of household debt, after mortgage debt.
Of course, no five indicators — or 25, or even 55 — can paint a complete picture of something as complex as the U.S. economy. But looking at different parts of the picture can help explain why so many Americans feel the economy isn’t working for them.
